- Data & Statistics
Access Quick Stats (searchable database)
The Quick Stats Database is the most comprehensive tool for accessing agricultural data published by NASS. It allows you to customize your query by commodity, location, or time period.
Access Quick Stats Lite
Quick Stats Lite provides a more structured approach to get commonly requested statistics from our online database.
Explore Statistics
County Level Information
Geospatial Data & Interactive Maps
- Publications
Browse NASS Reports
- by Subject
- by Date (Reports Calendar)
- by Title/Release Day
- by Keyword
- Guide to Products and Services
Additional Reports
Historical Publications
- Archived Ag Census Reports (2002 and prior - published every 5 years)
- Annual Agricultural Statistics
- Statistical Bulletins (final estimates, 1987 to 2012
- Track Records: (crops, livestock, grain stocks)
- Trends 20th century
- Price Reactions (after crop or livestock reports)
Receive Reports by Email:
- Newsroom
News Releases
03/28/24 United States hog inventory up 1%
03/28/24 US farmers expect to plant less corn and more soybean acres
03/26/24 USDA to host Data Users’ Meeting to gather public input on statistical programs
Read More News
ASB Notices
04/15/24 NASS appoints Lance Honig as new ASB Chair
04/09/24 NASS discontinues select 2024 data collection programs and reports
04/04/24 NASS announces program changes following five-year review
02/23/24 NASS Delays Cold Storage Data Release
12/19/23 NASS seeks public input during survey program review
Read More Notices
Videos
02/13/24 2022 Census of Agriculture Data Highlights
02/13/24 How to Find 2022 Census of Agriculture Data
02/13/24 2022 Census of Agriculture Data Release Event
07/16/21 What is a Farm?
08/05/20 The NASS Mission: We do it for you
View More Videos
ASB Briefings
04/17/24 National Hemp Report (April 2024)
04/11/24 Crop Production (April 2024)
03/28/24 Quarterly Hogs and Pigs (March 2024)
03/28/24 Grain Stocks, Prospective Plantings, Rice Stocks (March 2024)
03/08/24 Crop Production (March 2024)
View More Briefings
- Surveys
- Census
- About NASS
Structure and Organization
- Agency Overview
- NASS Biographies
- Organizational Chart
- Assistance to Other Organizations
- International Programs
- NASS Strategic Plan for FY 2022-2026
- USDA Strategic Goals
- NASS Climate Adaptation and Resilience Plan
Guiding Principles
- Mission and Core Values
- Keeping Data Safe
- Confidentiality Pledge
- Security Pledge
- Security Statement
- Statement of Commitment to Scientific Integrity
- Regulations Guiding NASS
- Information Quality
Civil Rights
- USDA and NASS Civil Rights Policy Statement
- Civil Rights Accountability Policy and Procedures
- No FEAR Act Notice
- No FEAR Act - NASS Data
-
REE Reasonable Accommodations and Personal Assistance Services
- NASS Disability Affirmative Action Plan
- How to File an EEO Complaint
- Contact information for NASS Civil Rights Office
Work at NASS
Education and Outreach
- Understanding Ag Statistics
- Data Users' Meetings
- Morris Hansen Lecture
- International Conference on Agricultural Statistics
History and Procedures
- Agricultural Statistics Board and Lockup
- Agricultural Statistics: A Historical Timeline
- The Story of U.S. Agricultural Estimates
- As We Recall: The Growth of Agricultural Estimates, 1933-1961
-
Safeguarding America's Agricultural Statistics Report and Video
- History of Ag Statistics
- Report Procedures
- An Evolving Statistical Service
- Fact Finders for Agriculture
- Hall of Fame
- Contact Us
Mailing Address:
USDA-NASS
1400 Independence Ave., SW
Washington, DC 20250Survey FAQs and Contact Us:
Access FAQs or submit a question.
Data Inquiries:
Hours: 7:30 a.m. - 4:00 p.m. Eastern Time
Monday - Friday, except federal holidays
Toll-Free: (800) 727-9540Media Inquiries:
Other USDA Inquiries:
Hours: 9:00 a.m. - 5:30 p.m. Eastern Time
Monday - Friday, except federal holidays
Toll-Free: (833) One-USDA
Email: askusda@usda.gov
Website: https://ask.usda.gov/s/Civil Rights Office:
June Turner, Director
Email: / Phone: (202) 720-8257Regional and State Field Offices:
Find contact information for Regional and State Field Offices
Ask a Specialist:
Have a specific question for one of our subject experts? Contact a specialist.
Web Content Publishing Schedule:
Section 207(f)(2) of the E-Government Act of 2002 requires federal agencies to develop an inventory of information to be published on their Web sites, establish a schedule for publishing information, make those schedules available for public comment, and post the schedules and priorities on the Web site.
- Help
Technical Issues
Surveys
2011 ARMS - Broiler Industry Highlights
In 2012, USDA’s National Agricultural Statistics Service and Economic Research Service
conducted the Agricultural Resource Management Survey (ARMS) of the U.S. broiler industry. During the first three months of 2012, trained enumerators conducted personal interviews with more than 2,000 broiler growers in the 17 largest broiler-producing states. The farmers provided information about their operating costs and farm-related income. Broiler producers were also asked about feed, housing, and sales during 2011. The following results are highlights of production practices and resource use.
- Broiler Weight
- Broiler Housing
- Farm Labor and Broiler Production
- Broiler Industry Production Practices
- Litter Handling
You can also download a PDF version of these highlights by clicking here.
Broiler Weight
ARMS results indicate that U.S. broiler production is shifting toward larger birds. Forty-two percent of birds produced in2011 fell into the two largest classes, compared to 26 percent just five years before (Fig. 1). The shift reflects continuing changes in markets for broilers (toward more processed products, and more exports of poultry and poultry products). Larger birds require longer production cycles — 61 days, on average, for the largest class, compared to 38 days for the smallest — and require more feed per pound of weight gain.
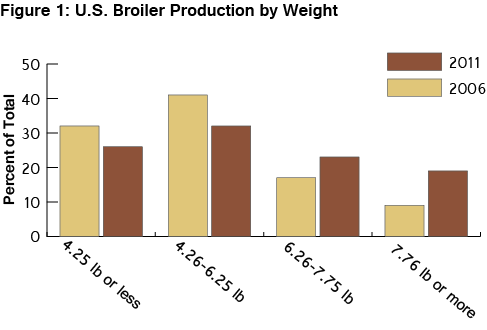
Smaller birds (less than 4.26 pounds) often go to fast food and food service sectors, while birds in the next larger class (4.26-6.25 pounds) go to retail groceries in tray pack or bagged forms. Birds in the two largest classes may be marketed to retail groceries, but are also often deboned and further processed into poultry products for several different sectors.
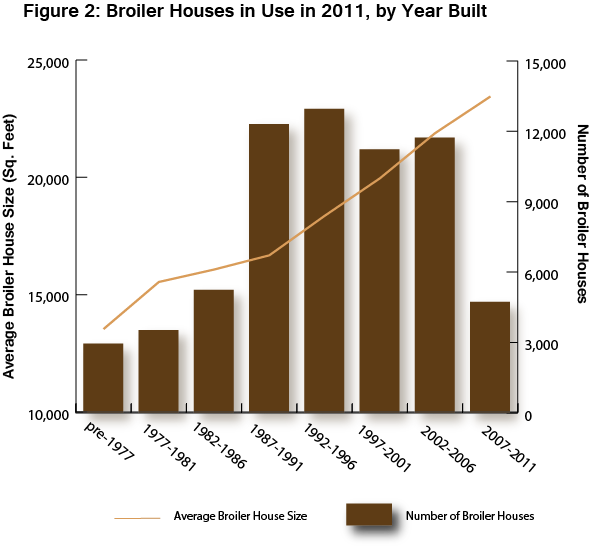
Broiler Housing
Broiler houses have gotten steadily larger over time (Fig. 2). Houses built during the 1980s were typically about 16,000 square feet (400 feet long by 40 feet wide). The industry standard grew to 20,000 square feet (500 by 40) by 2000. Houses built in 2007-2011 averaged over 23,000 square feet. Many retained the 500 foot length, but were 50, 55, or 60 feet wide, while the largest new houses were nearly 40,000 square feet (600 by 66). When it comes to the year built, 31 percent of today’s broiler houses were built since 2000, and another 39 percent were built in the 1990s. The rest of U.S. broiler houses were built prior to the 1990s.
Farm Labor and Broiler Production
ARMS results show that small operations, those with one or two broiler houses, relied on labor from the operator and the operator’s family (usually a spouse), and often combined broiler production with off-farm employment in 2011. Operations with more broiler houses relied more on hired labor in addition to that provided by the farm family, and the total family commitment increased toward 50 hours a week from less than 40 (Table 1).
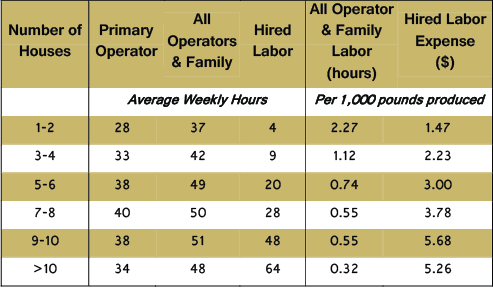
While the farm family’s labor commitment increased as the broiler operation grew larger, it did not rise proportionately with broiler production. The hours required, per 1,000 pounds of live-weight production declined sharply as operations added capacity and production.
Family labor, including that of the operator, was not paid a salary, and was therefore not included in cash expenses, unless the farm was incorporated. Hired labor is a cash expense, and the cost of hired labor per 1,000 pounds of live-weight production rose on larger farms as more hired labor was used.
Broiler Industry Production Practices
Several practices were widespread on broiler operations in the United States in 2011, according to ARMS results. For example, almost all had specific practices to control rodent and wild bird access to facilities, and almost all rotated flocks on an all-in, all-out basis(Fig. 3).
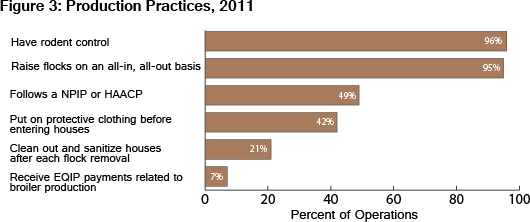
Nearly half of broiler operations reported that they follow the National Poultry Improvement Plan (NPIP) or a Hazard Analysis and Critical Control Point (HACCP) Plan, which are designed to improve animal health, food safety and food quality. A fifth of operations fully cleaned out and sanitized their houses after each flock removal.
Nearly half of broilers that died on the farm were disposed of through composting, while incineration was used for another quarter. USDA may provide support for incineration and composting facilities, as well as litter management practices, through payments made under the Environmental Quality Incentive Program (EQIP). Seven percent of contract growers received EQIP payments related to broiler production in 2011.
Litter Handling
Two-thirds (66.8%) of litter was removed from broiler operations in 2011 (Fig. 4), up from 61 percent in 2006, and just under a third (31.5%) was applied to fields on the broiler farm as fertilizer.
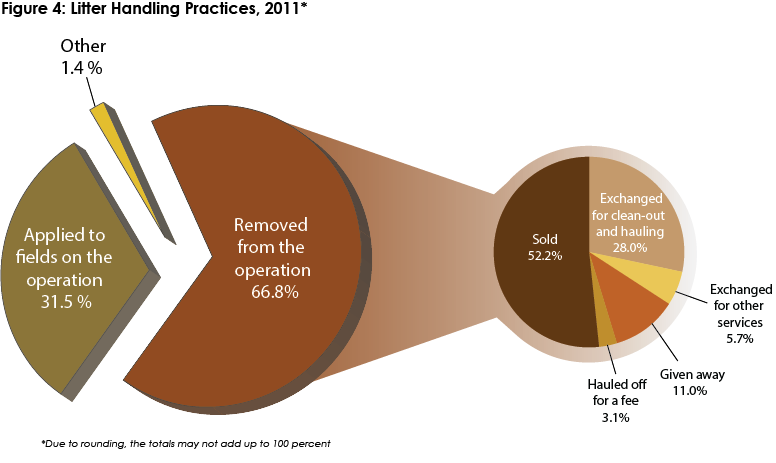
Litter has increasing value. More than half (52.2%) the litter removed from broiler farms in 2011 was sold, compared to 36 percent in 2006. Only 11 percent of litter was given away for free, compared to 21 percent in 2006. Prices received for litter depend on local demand and on prices for commercial fertilizer, which were much higher in 2011 than in 2006.
Last Modified: 12/12/2018