- Data & Statistics
Access Quick Stats (searchable database)
The Quick Stats Database is the most comprehensive tool for accessing agricultural data published by NASS. It allows you to customize your query by commodity, location, or time period.
Access Quick Stats Lite
Quick Stats Lite provides a more structured approach to get commonly requested statistics from our online database.
Explore Statistics
County Level Information
Geospatial Data & Interactive Maps
- Publications
Browse NASS Reports
- by Subject
- by Date (Reports Calendar)
- by Title/Release Day
- by Keyword
- Guide to Products and Services
Additional Reports
Historical Publications
- Archived Ag Census Reports (2002 and prior - published every 5 years)
- Annual Agricultural Statistics
- Statistical Bulletins (final estimates, 1987 to 2012
- Track Records: (crops, livestock, grain stocks)
- Trends 20th century
- Price Reactions (after crop or livestock reports)
Receive Reports by Email:
- Newsroom
News Releases
05/15/24 NASS releases Census of Agriculture Congressional District Profiles and Rankings
05/10/24 USDA forecasts winter wheat production up 2% in 2024, orange production down 2% from April forecast
04/19/24 USDA NASS announces retirement of Administrator Hubert Hamer
03/28/24 United States hog inventory up 1%
03/28/24 US farmers expect to plant less corn and more soybean acres
Read More News
ASB Notices
04/15/24 NASS appoints Lance Honig as new ASB Chair
04/09/24 NASS discontinues select 2024 data collection programs and reports
04/04/24 NASS announces program changes following five-year review
02/23/24 NASS Delays Cold Storage Data Release
12/19/23 NASS seeks public input during survey program review
Read More Notices
Videos
02/13/24 2022 Census of Agriculture Data Highlights
02/13/24 How to Find 2022 Census of Agriculture Data
02/13/24 2022 Census of Agriculture Data Release Event
07/16/21 What is a Farm?
08/05/20 The NASS Mission: We do it for you
View More Videos
ASB Briefings
05/10/24 Crop Production (May 2024)
04/17/24 National Hemp Report (April 2024)
04/11/24 Crop Production (April 2024)
03/28/24 Quarterly Hogs and Pigs (March 2024)
03/28/24 Grain Stocks, Prospective Plantings, Rice Stocks (March 2024)
View More Briefings
- Surveys
- Census
- About NASS
Structure and Organization
- Agency Overview
- NASS Biographies
- Organizational Chart
- Assistance to Other Organizations
- International Programs
- NASS Strategic Plan for FY 2022-2026
- USDA Strategic Goals
- NASS Climate Adaptation and Resilience Plan
Guiding Principles
- Mission and Core Values
- Keeping Data Safe
- Confidentiality Pledge
- Security Pledge
- Security Statement
- Statement of Commitment to Scientific Integrity
- Regulations Guiding NASS
- Information Quality
Civil Rights
- USDA and NASS Civil Rights Policy Statement
- Civil Rights Accountability Policy and Procedures
- No FEAR Act Notice
- No FEAR Act - NASS Data
-
REE Reasonable Accommodations and Personal Assistance Services
- NASS Disability Affirmative Action Plan
- How to File an EEO Complaint
- Contact information for NASS Civil Rights Office
Work at NASS
Education and Outreach
- Understanding Ag Statistics
- Data Users' Meetings
- Morris Hansen Lecture
- International Conference on Agricultural Statistics
History and Procedures
- Agricultural Statistics Board and Lockup
- Agricultural Statistics: A Historical Timeline
- The Story of U.S. Agricultural Estimates
- As We Recall: The Growth of Agricultural Estimates, 1933-1961
-
Safeguarding America's Agricultural Statistics Report and Video
- History of Ag Statistics
- Report Procedures
- An Evolving Statistical Service
- Fact Finders for Agriculture
- Hall of Fame
- Contact Us
Mailing Address:
USDA-NASS
1400 Independence Ave., SW
Washington, DC 20250Survey FAQs and Contact Us:
Access FAQs or submit a question.
Data Inquiries:
Hours: 7:30 a.m. - 4:00 p.m. Eastern Time
Monday - Friday, except federal holidays
Toll-Free: (800) 727-9540Media Inquiries:
Other USDA Inquiries:
Hours: 9:00 a.m. - 5:30 p.m. Eastern Time
Monday - Friday, except federal holidays
Toll-Free: (833) One-USDA
Email: askusda@usda.gov
Website: https://ask.usda.gov/s/Civil Rights Office:
June Turner, Director
Email: / Phone: (202) 720-8257Regional and State Field Offices:
Find contact information for Regional and State Field Offices
Ask a Specialist:
Have a specific question for one of our subject experts? Contact a specialist.
Web Content Publishing Schedule:
Section 207(f)(2) of the E-Government Act of 2002 requires federal agencies to develop an inventory of information to be published on their Web sites, establish a schedule for publishing information, make those schedules available for public comment, and post the schedules and priorities on the Web site.
- Help
Technical Issues
Research and Science
Disaster Analysis 2017
NASS can now monitor agricultural disasters in near real-time and provide quantitative assessments using remotely sensed data and geospatial techniques. This page provides disaster assessments in geospatial data format, reports, and metadata as available. A flood monitoring methodology paper is located here.
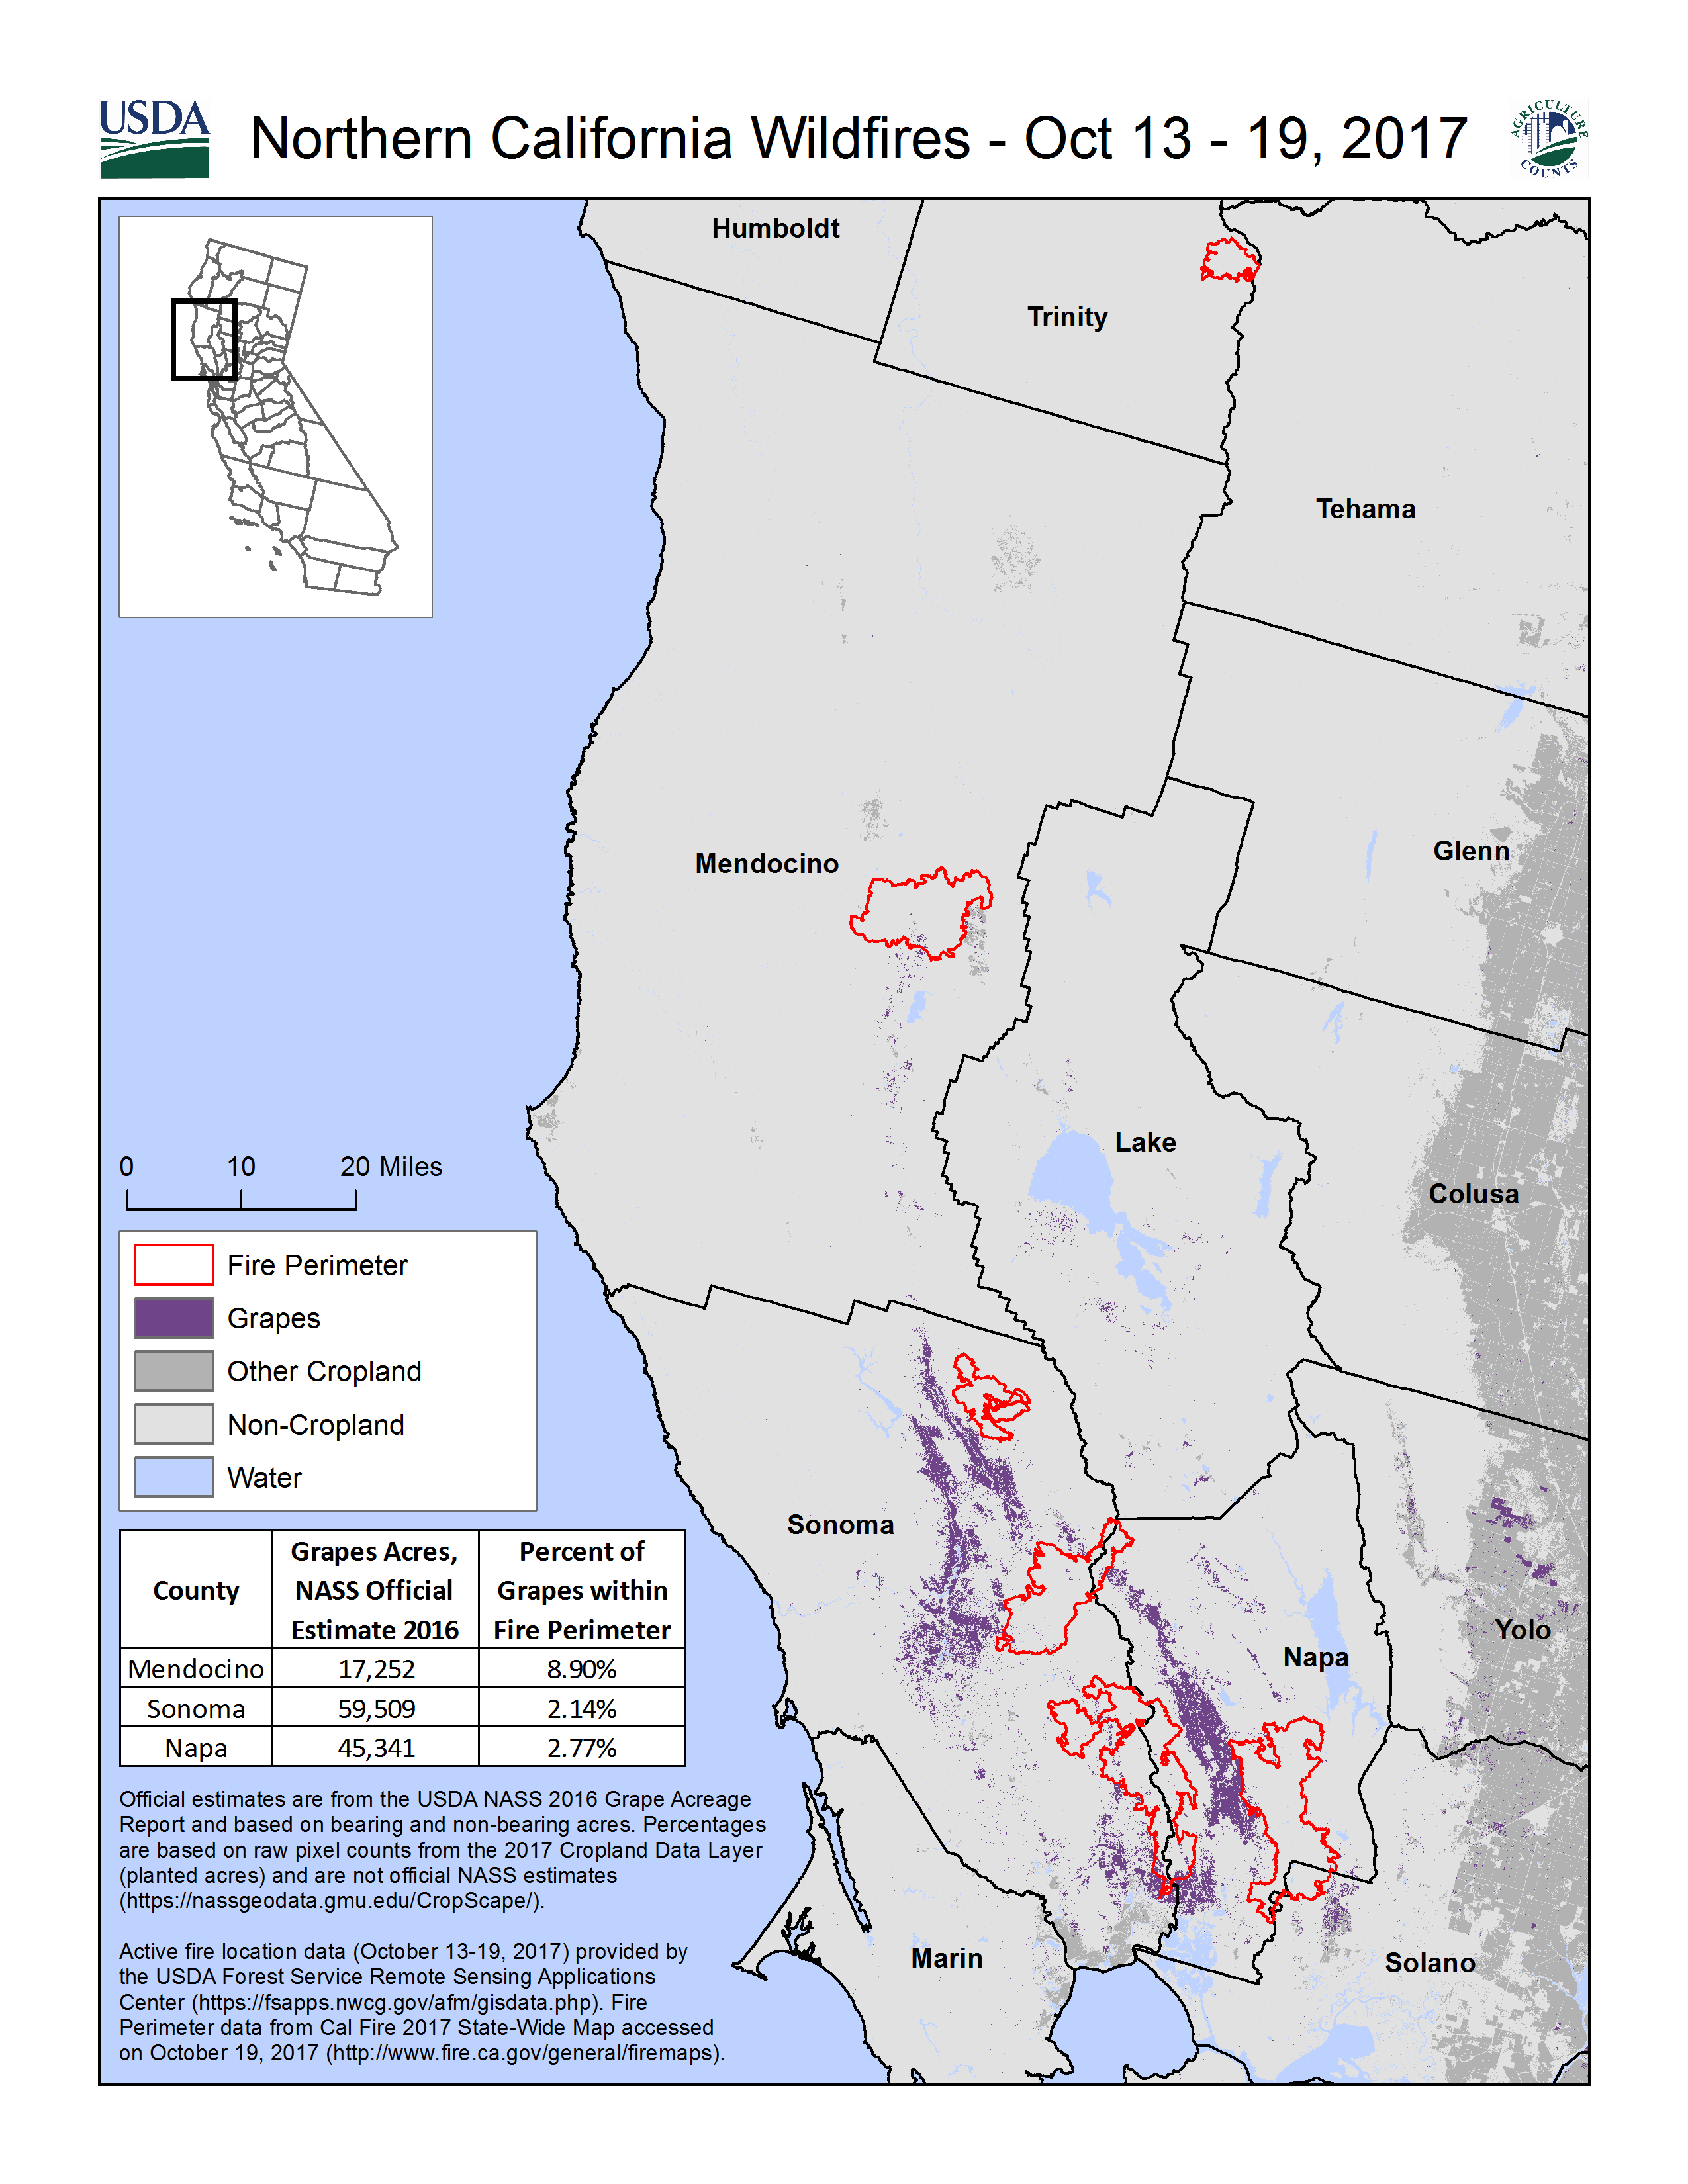
Northern California Wildfires – Wine Country (October 2017)
A series of wildfires broke out in Northern California in October 2017. Wildfires included the Atlas, Nuns, Tubbs, Pocket, and Redwood wildfires which occurred between October 8, 2017 and October 31, 2017. The United States Department of Agriculture's National Agricultural Statistics Service (NASS) responded to inquiries regarding the extent of cropland, specifically grapes, affected by the fires in near real-time. Active fire location data from USDA Forest Service Remote Sensing Applications Center and Cal Fire, along with the NASS Cropland Data Layer, were used to determine fire burn scars in the Mendocino, Sonoma, and Napa Counties, California. This analysis was completed and distributed to the Agricultural Statistics Board on October 19, 2017.
Files available for download:
Synopsis | Shapefile | Metadata
Download higher resolution map: PNG | PDF | SVG
Hurricane Irma (September 2017)
Hurricane Irma impacted Florida, United States from September 10 – 13, 2017. The United States Department of Agriculture's National Agricultural Statistics Service (NASS) responded to various inquiries regarding the extent of flooding from Hurricane Irma over both cultivated land and pasture/hay in near real-time. Consequently, a flood mapping procedure, based on Copernicus Sentinel-1 Synthetic Aperture Radar data and the NASS Cropland Data Layer, was implemented in response to the flood event. The data, maps, and reports below illustrate and estimate the extent of inundation over cropland and pasture based on this analysis. The crop inundation layers are publically available for download.
Files available for download: Assessment Report | Methodology Paper | Raster Data Zipfile | Synopsis | Wind Swath Maps Zipfile | County Maps Zipfile | Metadata

Download higher resolution map: PNG | PDF
Hurricane Harvey (August 2017)
Hurricane Harvey struck areas of Texas and Louisiana, United States from August 25 thru August 31, 2017. The United States Department of Agriculture's National Agricultural Statistics Service (NASS) responded to several inquiries regarding the extent of flooding due to Hurricane Harvey over agricultural land in near real-time. Consequently, a recently developed flood mapping procedure, based on Copernicus Sentinel-1 Synthetic Aperture Radar data and the NASS Cropland Data Layer, was implemented in response to the flood event. The data, maps, and reports below illustrate and estimate the extent of inundation over cropland and pasture based on this analysis. The crop inundation layers are publically available for download.
Files available for download: Assessment Report | Methodology Paper | Raster data zipfile | Synopsis | Metadata

Download higher resolution map: PNG
Previous Years:
Return to current yearLast Modified: 03/20/2024