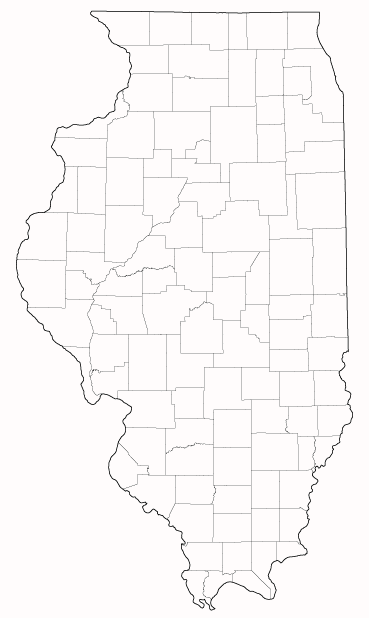
2024 STATE AGRICULTURE OVERVIEW
Illinois
† Survey Data from Quick Stats as of: Jan/12/2026
| Farm Operations - Area Operated, Measured in Acres / Operation | 376 |
| Farm Operations - Number of Operations | 70,000 |
| Farm Operations - Acres Operated | 26,300,000 |
| Cattle, Cows, Beef - Inventory ( First of Jan. 2025 ) | 333,000 |
| Cattle, Cows, Milk - Inventory ( First of Jan. 2025 ) | 77,000 |
| Cattle, Incl Calves - Inventory ( First of Jan. 2025 ) | 1,020,000 |
| Cattle, On Feed - Inventory ( First of Jan. 2025 ) | 250,000 |
| Goats, Meat & Other - Inventory ( First of Jan. 2025 ) | 25,000 |
| Goats, Milk - Inventory ( First of Jan. 2025 ) | 9,600 |
| Sheep, Incl Lambs - Inventory ( First of Jan. 2025 ) | 58,000 |
| Hogs - Inventory ( First of Dec. 2024 ) | 5,500,000 |
| Milk - Production, Measured in Lb / Head | 21,782 |
| Milk - Production, Measured in $ | 378,877,000 |
| Milk - Production, Measured in Lb | 1,699,000,000 |

Crops - Planted, Harvested, Yield, Production, Price (MYA), Value of Production †
Sorted by Value of Production in Dollars
Sorted by Value of Production in Dollars
| Commodity | Planted All Purpose Acres | Harvested Acres | Yield | Production | Price per Unit | Value of Production in Dollars |
|---|---|---|---|---|---|---|
| CORN | ||||||
| CORN, GRAIN | 10,650,000 | 217 BU / ACRE | 2,311,050,000 BU | 4.18 $ / BU | 9,937,515,000 | |
| CORN, SILAGE | 90,000 | 24 TONS / ACRE | 2,160,000 TONS | |||
| CORN | 10,800,000 | |||||
| SOYBEANS | ||||||
| SOYBEANS | 10,800,000 | 10,750,000 | 64 BU / ACRE | 688,000,000 BU | 10.2 $ / BU | 7,086,400,000 |
| WHEAT | ||||||
| WHEAT, WINTER | 770,000 | 700,000 | 86 BU / ACRE | 60,200,000 BU | 5.4 $ / BU | 325,080,000 |
| WHEAT | 770,000 | 700,000 | 86 BU / ACRE | 60,200,000 BU | 5.4 $ / BU | 325,080,000 |
| HAY & HAYLAGE | ||||||
| HAY & HAYLAGE | 455,000 | 3.6 TONS / ACRE, DRY BASIS | 1,637,000 TONS, DRY BASIS | 277,223,000 | ||
| HAY & HAYLAGE, ALFALFA | 35,000 | 265,000 | 4.17 TONS / ACRE, DRY BASIS | 1,104,000 TONS, DRY BASIS | 203,136,000 | |
| HAY & HAYLAGE, (EXCL ALFALFA) | 190,000 | 2.81 TONS / ACRE, DRY BASIS | 533,000 TONS, DRY BASIS | 74,087,000 | ||
| HAY | ||||||
| HAY | 445,000 | 3.31 TONS / ACRE | 1,475,000 TONS | 167 $ / TON | 248,900,000 | |
| HAY, ALFALFA | 260,000 | 3.75 TONS / ACRE | 975,000 TONS | 181 $ / TON | 179,400,000 | |
| HAY, (EXCL ALFALFA) | 185,000 | 2.7 TONS / ACRE | 500,000 TONS | 134 $ / TON | 69,500,000 | |
| PUMPKINS | ||||||
| PUMPKINS | 15,500 | 15,400 | 315 CWT / ACRE | 4,851,000 CWT | 4.26 $ / CWT | 20,602,000 |
| PUMPKINS, PROCESSING | 50.4 $ / TON | 10,953,000 | ||||
| PUMPKINS, FRESH MARKET | 19.5 $ / CWT | 9,649,000 | ||||
| PUMPKINS, UTILIZED | 4,841,300 CWT | |||||
| SWEET CORN | ||||||
| SWEET CORN | 8,400 | 8,300 | 155 CWT / ACRE | 1,286,500 CWT | 14.4 $ / CWT | 18,437,000 |
| SWEET CORN, UTILIZED | 1,283,900 CWT | |||||
| SWEET CORN, PROCESSING | (D) $ / TON | (D) | ||||
| SWEET CORN, FRESH MARKET | (D) $ / CWT | (D) | ||||
| BEANS | ||||||
| BEANS, SNAP | 6,500 | 6,400 | 81 CWT / ACRE | 518,400 CWT | 22.7 $ / CWT | 11,756,000 |
| BEANS, SNAP, UTILIZED | 518,400 CWT | |||||
| BEANS, SNAP, PROCESSING | (D) $ / TON | (D) | ||||
| BEANS, SNAP, FRESH MARKET | (D) $ / CWT | (D) | ||||
| OATS | ||||||
| OATS | 50,000 | 17,000 | 93 BU / ACRE | 1,581,000 BU | 4.23 $ / BU | 6,008,000 |
| HAYLAGE | ||||||
| HAYLAGE, ALFALFA | 30,000 | 8.7 TONS / ACRE | 261,000 TONS | |||
| HAYLAGE | 41,000 | 7.98 TONS / ACRE | 327,000 TONS | |||
| HAYLAGE, (EXCL ALFALFA) | 11,000 | 6 TONS / ACRE | 66,000 TONS | |||
(NA) Not Available
(D) Withheld to avoid disclosing data for individual operations
(S) Insufficient number of reports to establish an estimate
(X) Not Applicable
(Z) Less than half the rounding unit
(D) Withheld to avoid disclosing data for individual operations
(S) Insufficient number of reports to establish an estimate
(X) Not Applicable
(Z) Less than half the rounding unit