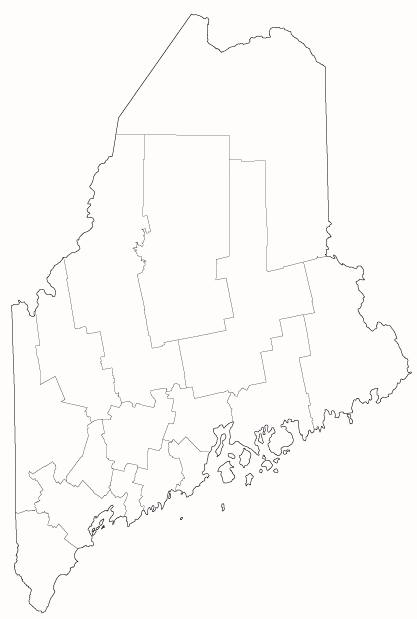
2024 STATE AGRICULTURE OVERVIEW
Maine
† Survey Data from Quick Stats as of: Feb/02/2026
| Farm Operations - Area Operated, Measured in Acres / Operation | 171 |
| Farm Operations - Number of Operations | 7,000 |
| Farm Operations - Acres Operated | 1,200,000 |
| Cattle, Incl Calves - Inventory ( First of Jan. 2025 ) | 73,000 |
| Milk - Production, Measured in Lb / Head | 22,667 |
| Milk - Production, Measured in $ | 124,032,000 |
| Milk - Production, Measured in Lb | 544,000,000 |

Crops - Planted, Harvested, Yield, Production, Price (MYA), Value of Production †
Sorted by Value of Production in Dollars
Sorted by Value of Production in Dollars
| Commodity | Planted All Purpose Acres | Harvested Acres | Yield | Production | Price per Unit | Value of Production in Dollars |
|---|---|---|---|---|---|---|
| POTATOES | ||||||
| POTATOES | 54,000 | 53,900 | 340 CWT / ACRE | 18,326,000 CWT | 14.8 $ / CWT | 271,225,000 |
| POTATOES, FRESH MARKET | 13.4 $ / CWT | |||||
| POTATOES, PROCESSING | 14.5 $ / CWT | |||||
| BLUEBERRIES | ||||||
| BLUEBERRIES, WILD, UTILIZED | 90,800,000 LB | 49,252,000 | ||||
| BLUEBERRIES, WILD, PROCESSING | 89,350,000 LB | 0.51 $ / LB | 45,569,000 | |||
| BLUEBERRIES, WILD, FRESH MARKET | 1,450,000 LB | 2.54 $ / LB | 3,683,000 | |||
| BLUEBERRIES, WILD | 19,100 | 4,760 LB / ACRE | 90,900,000 LB | 0.542 $ / LB | ||
| HAY | ||||||
| HAY | 118,000 | 1.85 TONS / ACRE | 218,000 TONS | 178 $ / TON | 38,378,000 | |
| HAY, (EXCL ALFALFA) | 110,000 | 1.8 TONS / ACRE | 198,000 TONS | 173 $ / TON | 33,858,000 | |
| HAY, ALFALFA | 8,000 | 2.5 TONS / ACRE | 20,000 TONS | 226 $ / TON | 4,520,000 | |
| HAY & HAYLAGE | ||||||
| HAY & HAYLAGE | 38,378,000 | |||||
| HAY & HAYLAGE, (EXCL ALFALFA) | 33,858,000 | |||||
| HAY & HAYLAGE, ALFALFA | 2,000 | 4,520,000 | ||||
| MAPLE SYRUP | ||||||
| MAPLE SYRUP | 0.369 GALLONS / TAP | 701,000 GALLONS | 39.5 $ / GALLON | 27,690,000 | ||
| MAPLE SYRUP, VALUE-ADDED PRODUCTS | ||||||
| BARLEY | ||||||
| BARLEY | 10,000 | 9,000 | 65 BU / ACRE | 585,000 BU | 6.6 $ / BU | 3,861,000 |
| CORN | ||||||
| CORN, SILAGE | 26,000 | 19 TONS / ACRE | 494,000 TONS | |||
| CORN | 30,000 | |||||
| OATS | ||||||
| OATS | 20,000 | 16,000 | 73 BU / ACRE | 1,168,000 BU | (D) $ / BU | (D) |
(NA) Not Available
(D) Withheld to avoid disclosing data for individual operations
(S) Insufficient number of reports to establish an estimate
(X) Not Applicable
(Z) Less than half the rounding unit
(D) Withheld to avoid disclosing data for individual operations
(S) Insufficient number of reports to establish an estimate
(X) Not Applicable
(Z) Less than half the rounding unit