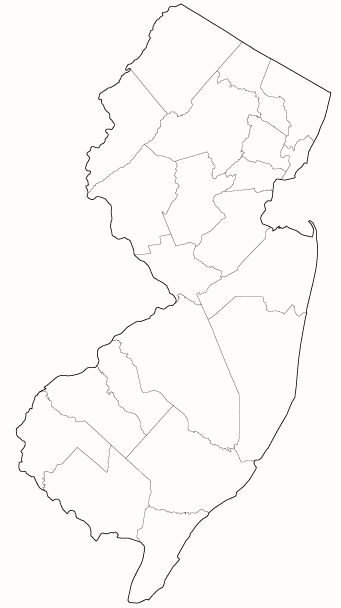
2023 STATE AGRICULTURE OVERVIEW
New Jersey
† Survey Data from Quick Stats as of: Jul/27/2024
| Farm Operations - Area Operated, Measured in Acres / Operation | 70 |
| Farm Operations - Number of Operations | 10,000 |
| Farm Operations - Acres Operated | 700,000 |
| Cattle, Cows, Beef - Inventory ( First of Jan. 2024 ) | 9,500 |
| Cattle, Cows, Milk - Inventory ( First of Jan. 2024 ) | 4,000 |
| Cattle, Incl Calves - Inventory ( First of Jan. 2024 ) | 26,000 |
| Hogs - Inventory ( First of Dec. 2023 ) | 6,000 |
| Milk - Production, Measured in Lb / Head | 21,500 |
| Milk - Production, Measured in $ | 17,544,000 |
| Milk - Production, Measured in Lb | 86,000,000 |

Crops - Planted, Harvested, Yield, Production, Price (MYA), Value of Production †
Sorted by Value of Production in Dollars
Sorted by Value of Production in Dollars
| Commodity | Planted All Purpose Acres | Harvested Acres | Yield | Production | Price per Unit | Value of Production in Dollars |
|---|---|---|---|---|---|---|
| BLUEBERRIES | ||||||
| BLUEBERRIES, TAME, UTILIZED | 25,075 TONS | 92,109,000 | ||||
| BLUEBERRIES, TAME, FRESH MARKET | 40,740,000 LB | 2.12 $ / LB | 86,369,000 | |||
| BLUEBERRIES, TAME, PROCESSING | 9,410,000 LB | 0.61 $ / LB | 5,740,000 | |||
| BLUEBERRIES, TAME | 10,800 | 2.33 TONS / ACRE | 25,150 TONS | 1.84 $ / LB | ||
| CORN | ||||||
| CORN, GRAIN | 65,000 | 168 BU / ACRE | 10,920,000 BU | 4.95 $ / BU | 54,054,000 | |
| CORN | 74,000 | |||||
| CORN, SILAGE | 6,000 | 18 TONS / ACRE | 108,000 TONS | |||
| SOYBEANS | ||||||
| SOYBEANS | 100,000 | 98,000 | 43 BU / ACRE | 4,214,000 BU | 12.8 $ / BU | 53,939,000 |
| PEPPERS | ||||||
| PEPPERS, BELL | 2,500 | 2,400 | 395 CWT / ACRE | 948,000 CWT | 38.1 $ / CWT | 36,059,000 |
| PEPPERS, BELL, UTILIZED | 946,100 CWT | |||||
| PEPPERS, BELL, PROCESSING | (D) $ / TON | (D) | ||||
| PEPPERS, BELL, FRESH MARKET | (D) $ / CWT | (D) | ||||
| HAY | ||||||
| HAY | 97,000 | 1.9 TONS / ACRE | 184,000 TONS | 168 $ / TON | 30,938,000 | |
| HAY, (EXCL ALFALFA) | 85,000 | 1.8 TONS / ACRE | 153,000 TONS | 155 $ / TON | 23,715,000 | |
| HAY, ALFALFA | 12,000 | 2.6 TONS / ACRE | 31,000 TONS | 233 $ / TON | 7,223,000 | |
| HAY & HAYLAGE | ||||||
| HAY & HAYLAGE | 30,938,000 | |||||
| HAY & HAYLAGE, (EXCL ALFALFA) | 23,715,000 | |||||
| HAY & HAYLAGE, ALFALFA | 2,000 | 7,223,000 | ||||
| PEACHES | ||||||
| PEACHES, FRESH MARKET | 14,200 TONS | 2,050 $ / TON | 29,110,000 | |||
| PEACHES, UTILIZED | 14,200 TONS | 29,110,000 | ||||
| PEACHES | 3,300 | 4.3 TONS / ACRE | 14,200 TONS | 2,050 $ / TON | ||
| CRANBERRIES | ||||||
| CRANBERRIES, UTILIZED | 28,942 TONS | 20,047,000 | ||||
| CRANBERRIES | 2,900 | 200.1 BARRELS / ACRE | 29,000 TONS | 34.6 $ / BARREL | ||
| CRANBERRIES, PROCESSING | (D) BARRELS | (D) $ / BARREL | (D) | |||
| CRANBERRIES, FRESH MARKET | (D) BARRELS | (D) $ / BARREL | (D) | |||
| SQUASH | ||||||
| SQUASH | 2,900 | 2,800 | 120 CWT / ACRE | 336,000 CWT | 47.3 $ / CWT | 15,718,000 |
| SQUASH, FRESH MARKET | 47.3 $ / CWT | 15,718,000 | ||||
| SQUASH, UTILIZED | 332,300 CWT | |||||
| WHEAT | ||||||
| WHEAT | 34,000 | 32,000 | 82 BU / ACRE | 2,624,000 BU | 5.6 $ / BU | 14,694,000 |
| WHEAT, WINTER | 34,000 | 32,000 | 82 BU / ACRE | 2,624,000 BU | 5.6 $ / BU | 14,694,000 |
| ASPARAGUS | ||||||
| ASPARAGUS | 2,000 | 1,900 | 32 CWT / ACRE | 60,800 CWT | 206 $ / CWT | 12,504,000 |
| ASPARAGUS, FRESH MARKET | 206 $ / CWT | 12,504,000 | ||||
| ASPARAGUS, UTILIZED | 60,700 CWT | |||||
| BEDDING PLANTS, ANNUAL | ||||||
| BEDDING PLANTS, ANNUAL | ||||||
| PROPAGATIVE MATERIAL | ||||||
| PROPAGATIVE MATERIAL, FLORICULTURE | ||||||
| CUT CULTIVATED GREENS | ||||||
| CUT CULTIVATED GREENS | ||||||
| FOLIAGE PLANTS | ||||||
| FOLIAGE PLANTS, INDOOR USE | ||||||
| CUT FLOWERS | ||||||
| CUT FLOWERS | ||||||
| BEDDING PLANTS, HERBACEOUS PERENNIAL | ||||||
| BEDDING PLANTS, HERBACEOUS PERENNIAL | ||||||
| FLOWERING PLANTS, POTTED | ||||||
| FLOWERING PLANTS, POTTED, INDOOR USE, POTS | ||||||
| SPINACH | ||||||
| SPINACH, UTILIZED | (D) CWT | |||||
| SPINACH, FRESH MARKET | (D) $ / CWT | (D) | ||||
| SPINACH | (D) | (D) | (D) CWT / ACRE | (D) CWT | (D) $ / CWT | (D) |
| SPINACH, PROCESSING | (D) $ / TON | (D) | ||||
(NA) Not Available
(D) Withheld to avoid disclosing data for individual operations
(S) Insufficient number of reports to establish an estimate
(X) Not Applicable
(Z) Less than half the rounding unit
(D) Withheld to avoid disclosing data for individual operations
(S) Insufficient number of reports to establish an estimate
(X) Not Applicable
(Z) Less than half the rounding unit