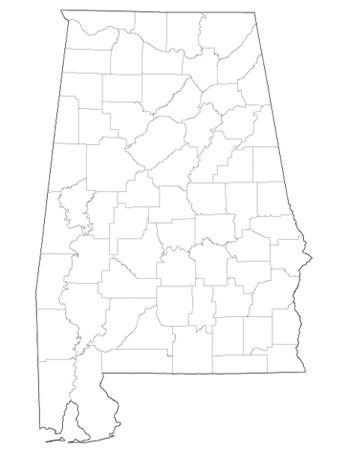
2024 STATE AGRICULTURE OVERVIEW
Alabama
† Survey Data from Quick Stats as of: Feb/06/2026
| Farm Operations - Area Operated, Measured in Acres / Operation | 232 |
| Farm Operations - Number of Operations | 37,100 |
| Farm Operations - Acres Operated | 8,600,000 |
| Cattle, Cows, Beef - Inventory ( First of Jan. 2025 ) | 648,000 |
| Cattle, Cows, Milk - Inventory ( First of Jan. 2025 ) | 2,000 |
| Cattle, Incl Calves - Inventory ( First of Jan. 2025 ) | 1,180,000 |
| Goats, Meat & Other - Inventory ( First of Jan. 2025 ) | 43,000 |
| Goats, Milk - Inventory ( First of Jan. 2025 ) | 4,400 |
| Chickens, Broilers - Production, Measured in Head | 1,168,400,000 |
| Milk - Production, Measured in Lb / Head | 11,739 |
| Milk - Production, Measured in $ | 6,696,000 |
| Milk - Production, Measured in Lb | 27,000,000 |

Crops - Planted, Harvested, Yield, Production, Price (MYA), Value of Production †
Sorted by Value of Production in Dollars
Sorted by Value of Production in Dollars
| Commodity | Planted All Purpose Acres | Harvested Acres | Yield | Production | Price per Unit | Value of Production in Dollars |
|---|---|---|---|---|---|---|
| HAY | ||||||
| HAY | 690,000 | 2.7 TONS / ACRE | 1,863,000 TONS | 117 $ / TON | 221,697,000 | |
| HAY, (EXCL ALFALFA) | 690,000 | 2.7 TONS / ACRE | 1,863,000 TONS | 117 $ / TON | 221,697,000 | |
| HAY & HAYLAGE | ||||||
| HAY & HAYLAGE, (EXCL ALFALFA) | 221,697,000 | |||||
| HAY & HAYLAGE | 221,697,000 | |||||
| COTTON | ||||||
| COTTON, UPLAND | 400,000 | 396,000 | 816 LB / ACRE | 673,000 480 LB BALES | 0.645 $ / LB | 189,898,000 |
| COTTON, COTTONSEED | 189,000 TONS | 175 $ / TON | 32,725,000 | |||
| COTTON | 400,000 | 396,000 | 816 LB / ACRE | 673,000 480 LB BALES | ||
| PEANUTS | ||||||
| PEANUTS | 190,000 | 188,000 | 3,060 LB / ACRE | 575,280,000 LB | 0.244 $ / LB | 131,976,000 |
| CORN | ||||||
| CORN, GRAIN | 270,000 | 112 BU / ACRE | 30,240,000 BU | 4.58 $ / BU | 126,672,000 | |
| CORN, SILAGE | 4,000 | 16 TONS / ACRE | 64,000 TONS | |||
| CORN | 280,000 | |||||
| SOYBEANS | ||||||
| SOYBEANS | 360,000 | 350,000 | 31 BU / ACRE | 10,850,000 BU | 10.2 $ / BU | 110,670,000 |
| WHEAT | ||||||
| WHEAT, WINTER | 110,000 | 60,000 | 71 BU / ACRE | 4,260,000 BU | 5.75 $ / BU | 24,495,000 |
| WHEAT | 110,000 | 60,000 | 71 BU / ACRE | 4,260,000 BU | 5.75 $ / BU | 24,495,000 |
(NA) Not Available
(D) Withheld to avoid disclosing data for individual operations
(S) Insufficient number of reports to establish an estimate
(X) Not Applicable
(Z) Less than half the rounding unit
(D) Withheld to avoid disclosing data for individual operations
(S) Insufficient number of reports to establish an estimate
(X) Not Applicable
(Z) Less than half the rounding unit