- Data & Statistics
Access Quick Stats (searchable database)
The Quick Stats Database is the most comprehensive tool for accessing agricultural data published by NASS. It allows you to customize your query by commodity, location, or time period.
Access Quick Stats Lite
Quick Stats Lite provides a more structured approach to get commonly requested statistics from our online database.
Explore Statistics
County Level Information
Geospatial Data & Interactive Maps
- Publications
Browse NASS Reports
- by Subject
- by Date (Reports Calendar)
- by Title/Release Day
- by Keyword
- Guide to Products and Services
Additional Reports
Historical Publications
- Archived Ag Census Reports (2002 and prior - published every 5 years)
- Annual Agricultural Statistics
- Statistical Bulletins (final estimates, 1987 to 2012
- Track Records: (crops, livestock, grain stocks)
- Trends 20th century
- Price Reactions (after crop or livestock reports)
Receive Reports by Email:
- Newsroom
News Releases
07/24/26 United States Cattle Inventory Up Slightly
06/30/26 Corn planted acreage down 3% from 2025, soybean acreage up 5% from last year
06/25/26 United States Hog Inventory Down Slightly
05/29/26 USDA to Gather Agricultural Conservation Data to Assess Trends and Improve Programs and Services
05/13/26 USDA requests producer input to support transparent reporting of 2026 crops, inventories, and values
Read More News
ASB Notices
06/22/26 NASS Adds Additional Counties to the 2025 Cotton County-level Estimates
12/22/25 USDA NASS reschedules reports due to December 24 & 26 government closure
11/19/25 USDA Reschedules Reports Affected by Lapse in Federal Funding
10/31/25 USDA’s National Agricultural Statistics Service (NASS) will release key data in November
08/28/25 NASS discontinues select data collection programs and reports
Read More Notices
Videos
02/13/24 2022 Census of Agriculture Data Highlights
02/13/24 How to Find 2022 Census of Agriculture Data
02/13/24 2022 Census of Agriculture Data Release Event
07/16/21 What is a Farm?
08/05/20 The NASS Mission: We do it for you
View More Videos
ASB Briefings
07/24/26 Cattle (July 2026)
07/10/26 Crop Production (July 2026)
06/30/26 Acreage and Grain Stocks (June 2026)
06/25/26 Quarterly Hogs and Pigs (June 2026)
06/11/26 Crop Production (June 2026)
View More Briefings
- Surveys
- Census
- About NASS
Structure and Organization
- Agency Overview
- NASS Biographies
- Organizational Chart
- Assistance to Other Organizations
- International Programs
- Talking About NASS - A guide for partners and stakeholders
- NASS Strategic Plan for FY 2022-2026
- USDA Strategic Goals
Guiding Principles
- Mission and Core Values
- Keeping Data Safe
- Confidentiality Pledge
- Security Pledge
- Security Statement
- Statement of Commitment to Scientific Integrity
- Regulations Guiding NASS
- Information Quality
- Learning Agenda, Fiscal Year 2024 -2026
Civil Rights
Work at NASS
Education and Outreach
- Understanding Ag Statistics
- Data Users' Meetings
- Morris Hansen Lecture
- International Conference on Agricultural Statistics
History and Procedures
- Agricultural Statistics Board and Lockup
- Agricultural Statistics: A Historical Timeline
- The Story of U.S. Agricultural Estimates
- As We Recall: The Growth of Agricultural Estimates, 1933-1961
-
Safeguarding America's Agricultural Statistics Report and Video
- History of Ag Statistics
- Report Procedures
- An Evolving Statistical Service
- Fact Finders for Agriculture
- Hall of Fame
- Contact Us
Mailing Address:
USDA-NASS
1400 Independence Ave., SW
Washington, DC 20250Survey FAQs and Contact Us:
Access FAQs or submit a question.
Data Inquiries:
Hours: 8:00 a.m. - 5:00 p.m. Central Standard Time
Monday - Friday, except federal holidays
Toll-Free: (800) 727-9540Media Inquiries:
Other USDA Inquiries:
Hours: Monday to Friday 8 a.m. - 5 p.m. EST
Toll-Free: (833) One-USDA
Email: askusda@usda.gov
Website: https://ask.usda.gov/s/Translation Services:
Regional and State Field Offices:
Find contact information for Regional and State Field Offices
Ask a Specialist:
Have a specific question for one of our subject experts? Contact a specialist.
Web Content Publishing Schedule:
Section 207(f)(2) of the E-Government Act of 2002 requires federal agencies to develop an inventory of information to be published on their Web sites, establish a schedule for publishing information, make those schedules available for public comment, and post the schedules and priorities on the Web site.
- Help
Technical Issues
Highlights
Beginning Farmers - Characteristics of Farmers by Years on Current Farm
June 2014 | ACH12-5 | Download pdf Version
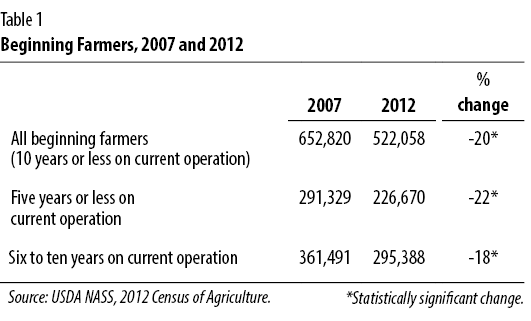
In 2012, the United States had 522,058 beginning farmers (principal operators who were on their current operation ten years or less). This was 20 percent fewer than in 2007, when the last agriculture census was conducted. Nevertheless, in 2012, beginning farmers operated one fourth of the 2.1 million U.S. farms.
This document summarizes the characteristics of beginning and established farmers and the farms they operate. It considers beginning farmers in two groupings – principal farm operators who were on their current operation five years or less at the end of 2012 (i.e, they started on their current farm in the years 2008 through 2012) and those who were on their current operation six to ten years (they started on their current farm in the years 2003 through 2007). Established farmers are those who were on their current operation eleven years or more.
- Beginning Farmer Characteristics
- Average Farm by Years on Farm
- Across the States
- Comparing 2007 and 2012
- New Data on Years of Experience
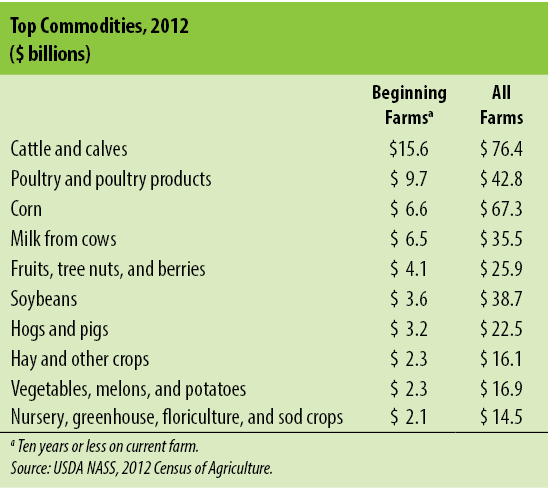
- Box: Top Commodities, 2012
Beginning Farmer Characteristics
Of total beginning farmers in the 2012 Census of Agriculture, 226,670 were on their current farm five years or less, and 295,388 were on their current farm six to ten years. (Table 1)
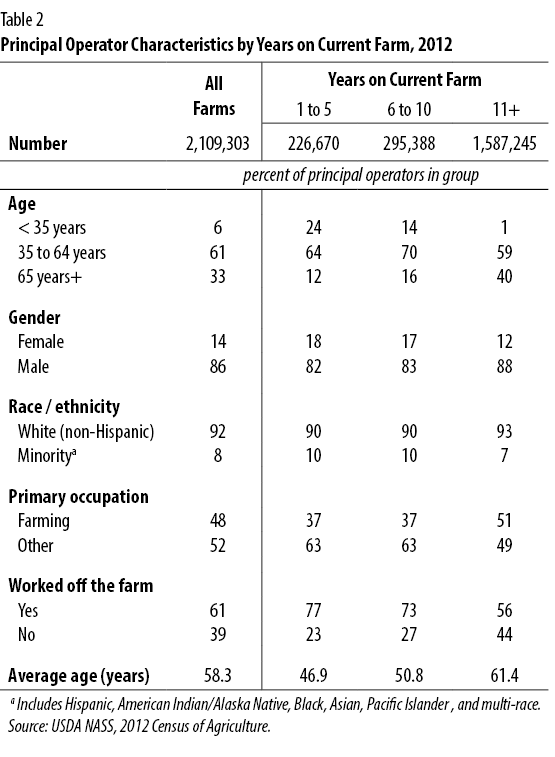
Beginning farmers were, on average, younger than more established farmers. Of established farmers, 40 percent were 65 years or older; among farmers operating their current farm five years or less, only 11 percent were 65 or older. The average age was 46.9 years for those on their current farm five years or less, 50.8 years for those on their current farms six to ten years, and 61.4 years for established farmers.
Beginning farmers were also more likely to be female than established farmers, more likely to be minority, more likely to spend some time working off the farm, and less likely to consider farming their primary occupation. (Table 2)
Average Farm by Years on Farm
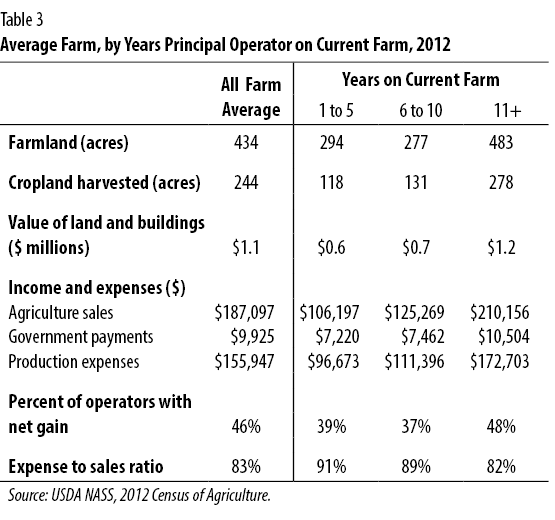
On average, farmers on their operations five years or less, as well as six to ten years, had smaller farms than established farmers in both agriculture sales and acres of farmland. A smaller percentage experienced a net gain from their operation. They had higher average expense-to-sales ratios and received less in government payments than established farmers. (Table 3)
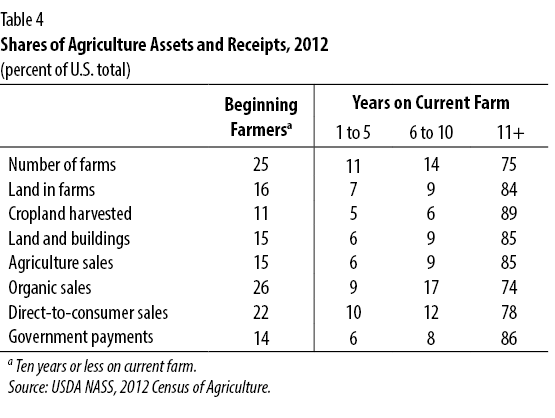
Beginning farmers operated 25 percent of U.S. farms, controlled 16 percent of farmland, and produced 15 percent of the value of agricultural products sold. They accounted for 22 percent of products sold directly to consumers and 26 percent of the value of organic sales. (Table 4)
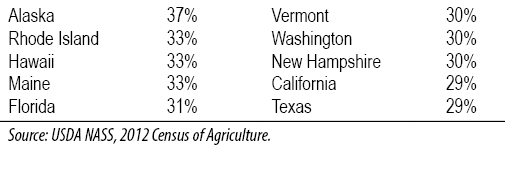
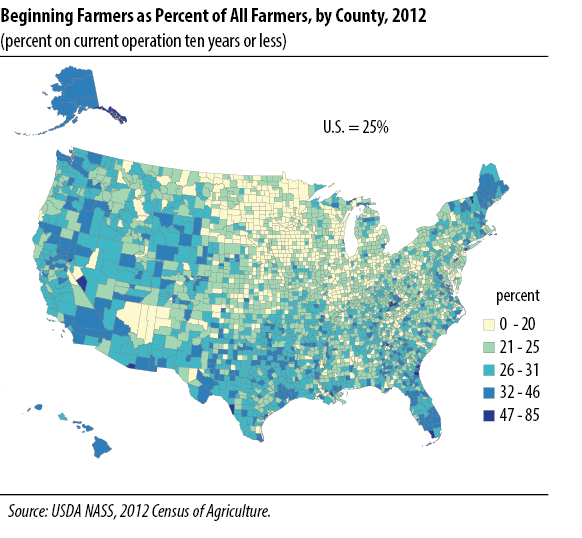
Across the States
Beginning farmers are found across the country, with some areas having relatively higher concentrations and some having few beginning farmers (map). The top ten states in percent of principal operators who are beginning farmers:
Comparing 2007 and 2012
This section looks at farmers five years or less on their current farm in a few key areas.
Farm Specialization. The number of farmers beginning on grain and oilseed farms, and on vegetable and melon farms, in the preceding five years was more than 30 percent higher in 2012 than 2007. Farms with a more than 30 percent decrease in such farmers included tobacco farms,cattle feedlots, hog and pig farms, poultry and egg farms, and other animal farms (including aquaculture, horses, etc.). The number of new farmers on beef cattle ranches was 19 percent fewer in 2012 than 2007.
Farm Size. The number of farmers on their current farm five years or less increased only among farms with 1,000 acres or more. Among the smallest farms – fewer than 50 acres – the number of farmers declined 28 percent between 2007 and 2012.

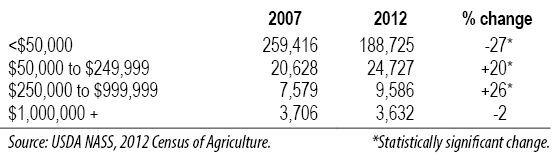
Economic Class. In terms of economic class (defined by agriculture sales plus government payments), the number of farm operators on current farm five years or less increased in two classes. In the $50,000 – $249,999 and the $250,000 – $999,999 economic classes, such operators increased 20 and 26 percent, respectively, between 2007 and 2012. However, farms in the groups that increased made up only 15 percent of farmers starting in the preceding five years.
New Data on Years of Experience
The 2012 Census of Agriculture asked a new question to capture the number of beginning farmers by their total years of experience. The new data show that some farmers who were on their current operation ten years or less in 2012 had prior farming experience on another operation.
The 226,670 principal farm operators on their current farm five years or less had operated a farm for an average of 7.1 years, and 39,821 of them had operated a farm for more than ten years (including both their current and prior operations).
The 295,388 principal farm operators on their current farm six to ten years had operated a farm for an average of 11.1 years; a third (99,841) had operated a farm for more than ten years. This new information on total experience will be analyzed further.
The data summarized in this Highlights are for years on current farm. Included are data not previously available that were specially tabulated in connection with the USDA Advisory Committee on Beginning Farmers and Ranchers meeting in June 2014.
About the Census of Agriculture
The Census of Agriculture is the leading source of facts and figures about American agriculture. The 2012 Census results provide information at national, state, and county levels about what agricultural products were raised in the United States in 2012, as well as where, how, and by whom.
For easy-to-use tools that help both professional and casual users find and use the data, go to www.nass.usda.gov/AgCensus.
Last Modified: 08/24/2018