- Data & Statistics
Access Quick Stats (searchable database)
The Quick Stats Database is the most comprehensive tool for accessing agricultural data published by NASS. It allows you to customize your query by commodity, location, or time period.
Access Quick Stats Lite
Quick Stats Lite provides a more structured approach to get commonly requested statistics from our online database.
Explore Statistics
County Level Information
Geospatial Data & Interactive Maps
- Publications
Browse NASS Reports
- by Subject
- by Date (Reports Calendar)
- by Title/Release Day
- by Keyword
- Guide to Products and Services
Additional Reports
Historical Publications
- Archived Ag Census Reports (2002 and prior - published every 5 years)
- Annual Agricultural Statistics
- Statistical Bulletins (final estimates, 1987 to 2012
- Track Records: (crops, livestock, grain stocks)
- Trends 20th century
- Price Reactions (after crop or livestock reports)
Receive Reports by Email:
- Newsroom
News Releases
07/24/24 NASS releases 2022 Census of Agriculture Watersheds Report
07/18/24 STAKEHOLDER ANNOUNCEMENT: USDA releases 2022 Puerto Rico Census of Agriculture
07/18/24 ANUNCIO DE LAS PARTES INTERESADAS: USDA publica el Censo de Agricultura de Puerto Rico 2022
06/28/24 Corn planted acreage down 3% from 2023, soybean acreage up 3% from last year
06/27/24 United States hog inventory up 1%
Read More News
ASB Notices
04/15/24 NASS appoints Lance Honig as new ASB Chair
04/09/24 NASS discontinues select 2024 data collection programs and reports
04/04/24 NASS announces program changes following five-year review
02/23/24 NASS Delays Cold Storage Data Release
12/19/23 NASS seeks public input during survey program review
Read More Notices
Videos
02/13/24 2022 Census of Agriculture Data Highlights
02/13/24 How to Find 2022 Census of Agriculture Data
02/13/24 2022 Census of Agriculture Data Release Event
07/16/21 What is a Farm?
08/05/20 The NASS Mission: We do it for you
View More Videos
ASB Briefings
07/12/24 Crop Production (July 2024)
06/28/24 Acreage Grain Stocks and Rice Stocks (June 2024)
06/27/24 Quarterly Hogs and Pigs (June 2024)
06/12/24 Crop Production (June 2024)
05/10/24 Crop Production (May 2024)
View More Briefings
- Surveys
- Census
- About NASS
Structure and Organization
- Agency Overview
- NASS Biographies
- Organizational Chart
- Assistance to Other Organizations
- International Programs
- NASS Strategic Plan for FY 2022-2026
- USDA Strategic Goals
- NASS Climate Adaptation and Resilience Plan
Guiding Principles
- Mission and Core Values
- Keeping Data Safe
- Confidentiality Pledge
- Security Pledge
- Security Statement
- Statement of Commitment to Scientific Integrity
- Regulations Guiding NASS
- Information Quality
Civil Rights
- USDA and NASS Civil Rights Policy Statement
- Civil Rights Accountability Policy and Procedures
- No FEAR Act Notice
- No FEAR Act - NASS Data
-
REE Reasonable Accommodations and Personal Assistance Services
- NASS Disability Affirmative Action Plan
- How to File an EEO Complaint
- Contact information for NASS Civil Rights Office
Work at NASS
Education and Outreach
- Understanding Ag Statistics
- Data Users' Meetings
- Morris Hansen Lecture
- International Conference on Agricultural Statistics
History and Procedures
- Agricultural Statistics Board and Lockup
- Agricultural Statistics: A Historical Timeline
- The Story of U.S. Agricultural Estimates
- As We Recall: The Growth of Agricultural Estimates, 1933-1961
-
Safeguarding America's Agricultural Statistics Report and Video
- History of Ag Statistics
- Report Procedures
- An Evolving Statistical Service
- Fact Finders for Agriculture
- Hall of Fame
- Contact Us
Mailing Address:
USDA-NASS
1400 Independence Ave., SW
Washington, DC 20250Survey FAQs and Contact Us:
Access FAQs or submit a question.
Data Inquiries:
Hours: 7:30 a.m. - 4:00 p.m. Eastern Time
Monday - Friday, except federal holidays
Toll-Free: (800) 727-9540Media Inquiries:
Other USDA Inquiries:
Hours: 9:00 a.m. - 5:30 p.m. Eastern Time
Monday - Friday, except federal holidays
Toll-Free: (833) One-USDA
Email: askusda@usda.gov
Website: https://ask.usda.gov/s/Civil Rights Office:
June Turner, Director
Email: / Phone: (202) 720-8257Translation Services:
Regional and State Field Offices:
Find contact information for Regional and State Field Offices
Ask a Specialist:
Have a specific question for one of our subject experts? Contact a specialist.
Web Content Publishing Schedule:
Section 207(f)(2) of the E-Government Act of 2002 requires federal agencies to develop an inventory of information to be published on their Web sites, establish a schedule for publishing information, make those schedules available for public comment, and post the schedules and priorities on the Web site.
- Help
Technical Issues
Surveys
2013 Agricultural Chemical Use Survey - Peanut Highlights
May 2014 | No. 2014-3 | Download PDF Version
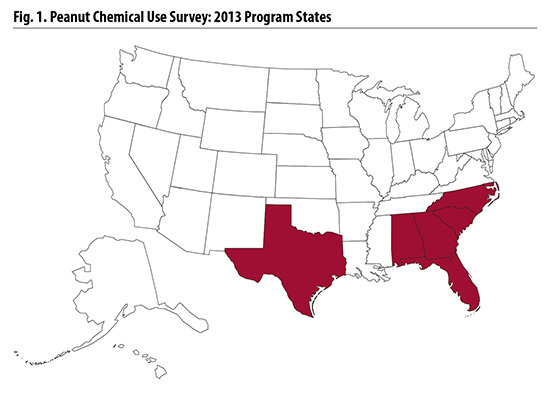
NASS conducted the 2013 Agricultural Chemical Use Survey among peanut producers in six states: Alabama, Florida, Georgia, North Carolina, South Carolina, and Texas (Fig. 1). These states accounted for 93 percent of the peanut acreage planted in the United States in the 2013 crop year. All 2013 peanut chemical use data refer to these “program states.”
Fertilizer Use
Nitrogen (N), phosphate (P2O5), and potash (K2O) were the most widely used fertilizer materials on peanuts. Farmers applied nitrogen to 40 percent of planted peanut acres, at an average rate of 31 pounds per acre for the 2013 crop year. They applied phosphate and potash to 42 percent of acres at an average rate of 43 and 72 pounds per acre, respectively. (Table 1)
In 2004, the last crop year for which NASS conducted the peanut chemical use survey, phosphate was applied to 66 percent of planted acres, followed by potash (63 percent) and nitrogen (60 percent).
Pesticide Use
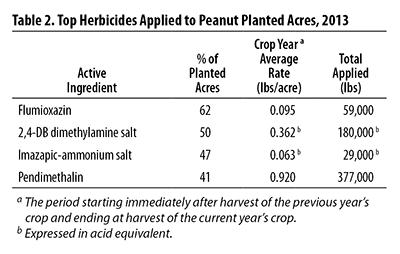
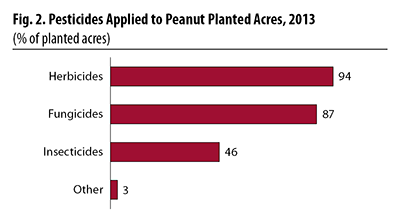
The pesticide active ingredients used on peanuts are classified in this report as herbicides, fungicides, insecticides, or other chemicals. Herbicides were used most extensively, applied to 94 percent of planted acres (Fig. 2). Fungicides and insecticides were applied to 87 and 46 percent of planted acres, respectively. Among herbicides, flumioxazin was the most widely used (62 percent of planted acres), followed by 2,4-DB dimethylamine salt (50 percent) (Table 2). In 2004, herbicides were applied to 98 percent of planted acres.
Pest Management Practices
The survey asked growers to report on the pest management practices they used on peanuts, with pests defined as weeds, insects, or diseases. Peanut growers reported practices in four categories of pest management strategy:
- Prevention practices keep a pest population from infesting a crop or field through various preceding actions.
- Avoidance practices mitigate or eliminate the detrimental effects of pests through cultural measures.
- Monitoring practices involve observing or detecting pests through systematic sampling, counting, or other forms of scouting.
- Suppression practices involve controlling or reducing existing pest populations to mitigate or eliminate crop damage.
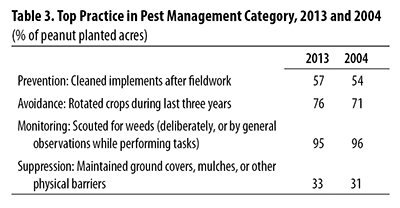
Scouting for weeds was the most widely reported monitoring practice, used on 95 percent of peanut planted acres. Among avoidance practices, crop rotation was practiced on 76 percent of planted acres. The most widely used prevention practice was cleaning implements after field work to reduce the spread of pests (57 percent). Maintaining ground covers, mulches, or other physical barriers was the most used suppression practice (33 percent). (Table 3)
Rotating crops and maintaining ground cover were also the top practice in their categories in 2004.
About the Survey
The Agricultural Chemical Use Program of the National Agricultural Statistics Service (NASS) is the U.S. Department of Agriculture’s official source of statistics about on-farm and post-harvest fertilizer and pesticide use and pest management practices. NASS conducts field crop agricultural chemical use surveys as part of the Agricultural Resource Management Survey.
NASS conducted the peanut chemical use survey in fall 2013, collecting data about fertilizer and pesticide use, as well as pest management practices, for the 2013 crop year. The 2013 crop year for peanuts began in 2012 immediately after harvest of the previous crop and ended in 2013 with harvest of that year’s crop.
Last Modified: 05/04/2018