- Data & Statistics
Access Quick Stats (searchable database)
The Quick Stats Database is the most comprehensive tool for accessing agricultural data published by NASS. It allows you to customize your query by commodity, location, or time period.
Access Quick Stats Lite
Quick Stats Lite provides a more structured approach to get commonly requested statistics from our online database.
Explore Statistics
County Level Information
Geospatial Data & Interactive Maps
- Publications
Browse NASS Reports
- by Subject
- by Date (Reports Calendar)
- by Title/Release Day
- by Keyword
- Guide to Products and Services
Additional Reports
Historical Publications
- Archived Ag Census Reports (2002 and prior - published every 5 years)
- Annual Agricultural Statistics
- Statistical Bulletins (final estimates, 1987 to 2012
- Track Records: (crops, livestock, grain stocks)
- Trends 20th century
- Price Reactions (after crop or livestock reports)
Receive Reports by Email:
- Newsroom
News Releases
06/30/26 Corn planted acreage down 3% from 2025, soybean acreage up 5% from last year
06/25/26 United States Hog Inventory Down Slightly
05/29/26 USDA to Gather Agricultural Conservation Data to Assess Trends and Improve Programs and Services
05/13/26 USDA requests producer input to support transparent reporting of 2026 crops, inventories, and values
03/31/26 US farmers expect to plant less corn and more soybean acres
Read More News
ASB Notices
06/22/26 NASS Adds Additional Counties to the 2025 Cotton County-level Estimates
12/22/25 USDA NASS reschedules reports due to December 24 & 26 government closure
11/19/25 USDA Reschedules Reports Affected by Lapse in Federal Funding
10/31/25 USDA’s National Agricultural Statistics Service (NASS) will release key data in November
08/28/25 NASS discontinues select data collection programs and reports
Read More Notices
Videos
02/13/24 2022 Census of Agriculture Data Highlights
02/13/24 How to Find 2022 Census of Agriculture Data
02/13/24 2022 Census of Agriculture Data Release Event
07/16/21 What is a Farm?
08/05/20 The NASS Mission: We do it for you
View More Videos
ASB Briefings
07/10/26 Crop Production (July 2026)
06/30/26 Acreage and Grain Stocks (June 2026)
06/25/26 Quarterly Hogs and Pigs (June 2026)
06/11/26 Crop Production (June 2026)
05/12/26 Crop Production (May 2026)
View More Briefings
- Surveys
- Census
- About NASS
Structure and Organization
- Agency Overview
- NASS Biographies
- Organizational Chart
- Assistance to Other Organizations
- International Programs
- Talking About NASS - A guide for partners and stakeholders
- NASS Strategic Plan for FY 2022-2026
- USDA Strategic Goals
Guiding Principles
- Mission and Core Values
- Keeping Data Safe
- Confidentiality Pledge
- Security Pledge
- Security Statement
- Statement of Commitment to Scientific Integrity
- Regulations Guiding NASS
- Information Quality
- Learning Agenda, Fiscal Year 2024 -2026
Civil Rights
Work at NASS
Education and Outreach
- Understanding Ag Statistics
- Data Users' Meetings
- Morris Hansen Lecture
- International Conference on Agricultural Statistics
History and Procedures
- Agricultural Statistics Board and Lockup
- Agricultural Statistics: A Historical Timeline
- The Story of U.S. Agricultural Estimates
- As We Recall: The Growth of Agricultural Estimates, 1933-1961
-
Safeguarding America's Agricultural Statistics Report and Video
- History of Ag Statistics
- Report Procedures
- An Evolving Statistical Service
- Fact Finders for Agriculture
- Hall of Fame
- Contact Us
Mailing Address:
USDA-NASS
1400 Independence Ave., SW
Washington, DC 20250Survey FAQs and Contact Us:
Access FAQs or submit a question.
Data Inquiries:
Hours: 8:00 a.m. - 5:00 p.m. Central Standard Time
Monday - Friday, except federal holidays
Toll-Free: (800) 727-9540Media Inquiries:
Other USDA Inquiries:
Hours: Monday to Friday 8 a.m. - 5 p.m. EST
Toll-Free: (833) One-USDA
Email: askusda@usda.gov
Website: https://ask.usda.gov/s/Translation Services:
Regional and State Field Offices:
Find contact information for Regional and State Field Offices
Ask a Specialist:
Have a specific question for one of our subject experts? Contact a specialist.
Web Content Publishing Schedule:
Section 207(f)(2) of the E-Government Act of 2002 requires federal agencies to develop an inventory of information to be published on their Web sites, establish a schedule for publishing information, make those schedules available for public comment, and post the schedules and priorities on the Web site.
- Help
Technical Issues
Highlights
Farm Demographics - U.S. Farmers by Gender, Age, Race, Ethnicity, and More
May 2014 | ACH12-3 | PDF Version
In 2012, U.S. farmers were older and more diverse than in 2007, the last time the agriculture census was conducted. The total number of farmers declined, with the percentage decline more for women than men. More minorities operated farms in 2012, and the number of beginning farmers declined.
- How Many Farmers?
- Fewer Women Farming
- Average Age Rising
- Increased Diversity
- Fewer New Farmers
- Snapshot of U.S. Farmers, 2012
How Many Farmers?
In 2012, 3.2 million farmers operated 2.1 million farms. Like the previous agriculture census, the 2012 Census of Agriculture collected data on up to three operators per farm. Whether counting only principal operators (the person primarily responsible for the day-to-day operation of the farm) or also second and third operators, the number of U.S. farmers declined between 2007 and 2012 going down 4.3 percent in the case of principal operators. (Table 1)
Table 1

Fourty-four percent of all farms reported having two operators, and 7 percent reported three operators involved in day-to-day decision making. Principal operators differ from second and third operators in a number of ways. They are on average older, more likely to be male, and more likely to consider farming their primary occupation. They work fewer days off the farm than do second and third operators, and in 2012, 78 percent were on their current farm ten or more years. (Table 2)
Table 2
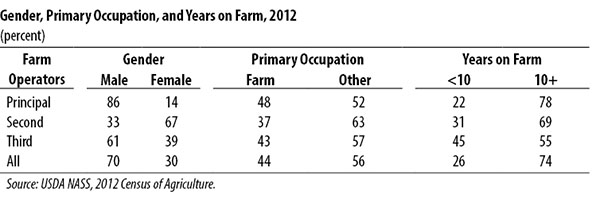
Two thirds (67 percent) of second operators are women, of whom 90 percent are the spouse of the principal farm operator. Most farm operations report that they are organized as a family or individual operation. Third operators are younger than principal operators and 45 percent were on their current farm less than ten years in 2012.
Fewer Women Farming
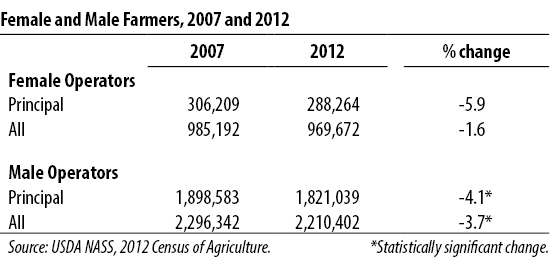
Of the 2.1 million principal operators in the United States, 288,264 were women (Table 3). This was a 6 percent decrease since 2007 larger than the decrease in male principal operators. But for all female operators (principal, second, and third), the decrease was only 1.6 percent. Women were 14 percent of principal operators but 30 percent of all operators.
Table 3
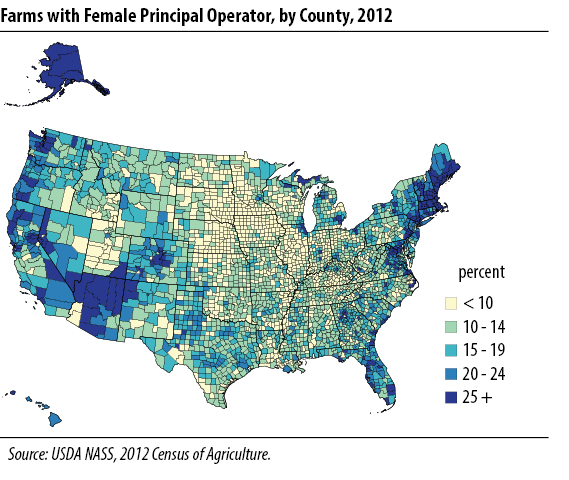
Some areas of the country have higher concentrations of women farmers than others. See particularly New England, Arizona, Oregon, and Washington (Fig. 1). In 16 states the number of female principal operators increased; in 34 states, they decreased.
Figure 1
The number of women operating farms with annual sales of $10,000 or more increased in all categories, but 91 percent of farms with female principal operators had less than $50,000 in annual sales (Table 4).
Table 4

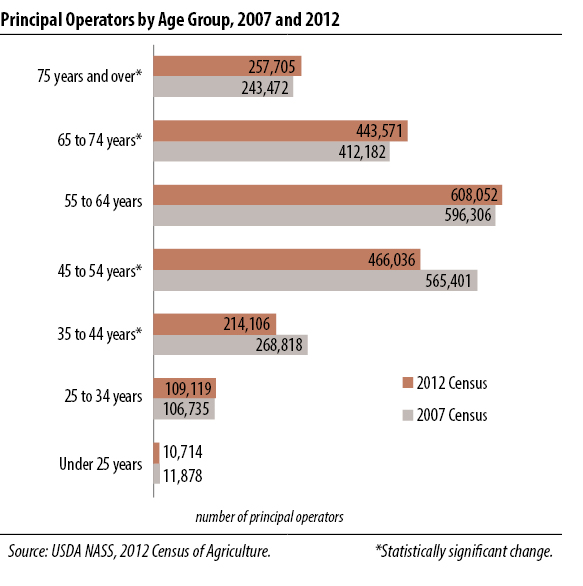
Average Age Rising
Consistent with a thirty-year trend, farmers average age continued to increase (Fig. 2). For principal operators, average age increased 2 percent between 2007 and 2012. Although second and third operators are younger, their average ages increased 4 and 3 percent respectively (Table 5). Among principal operators, 6 percent are under 35 years old, 61 percent are 35 to 64 years, and 33 percent are 65 and older. The older age groups all increased in number. (Fig. 3)
Figure 2
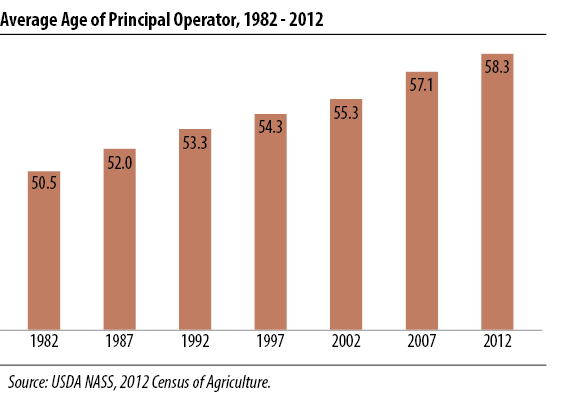
Table 5
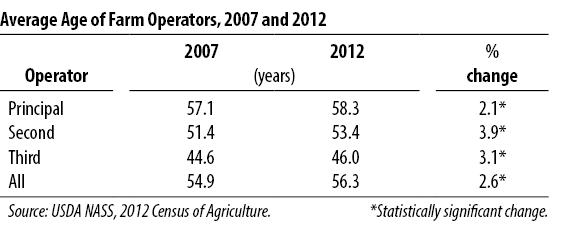
Figure 3
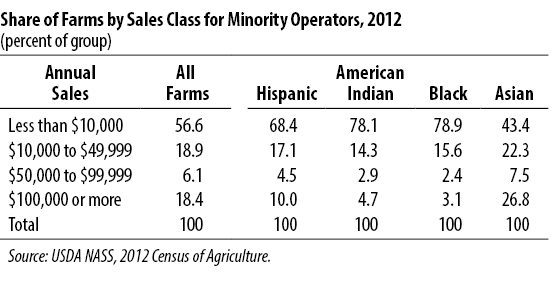
Increased Diversity
All categories of minority-operated farms increased between 2007 and 2012 (Fig. 4). Hispanic-operated farms were up 21 percent. Although more than half of all farms had sales of less than $10,000, minority-operated farms (except for Asian operated-farms) fell disproportionately into this group. In 2012, more than a third of Asian principal farmers operated farms with sales of $50,000 or more. (Table 6)
Figure 4
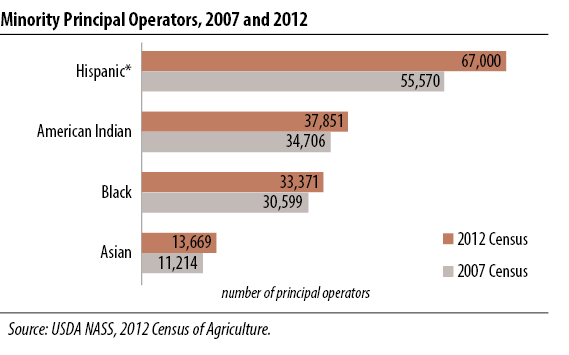
Table 6
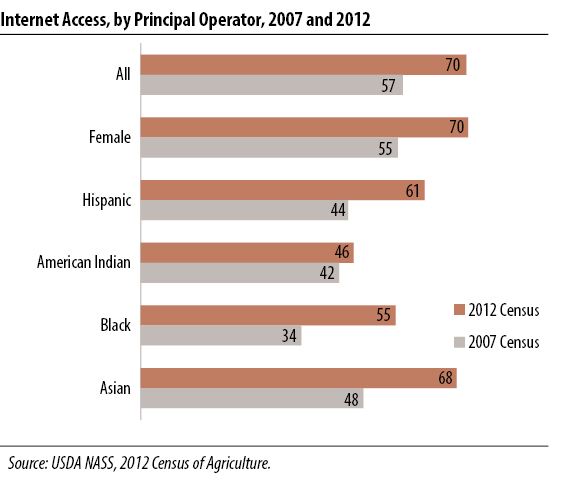
In 2012, 70 percent of farms had Internet access, up from the last agriculture census. For all groups of minority farmers, access was higher in 2012 than 2007, with Black- and Asian-operated farms each having about a twenty percentage point increase. (Fig. 5)
Figure 5
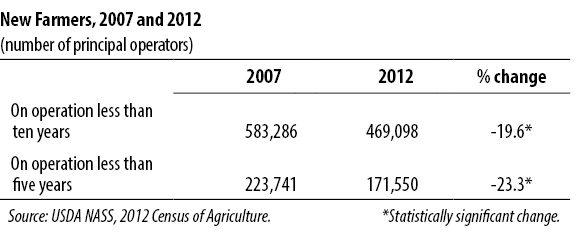
Fewer New Farmers
In 2012, the number of new farmers who have been on their current operation less than ten years was down 20 percent from 2007. Nearly 172,000 were on their current operation less than five years; this group was down 23 percent from 2007 (Table 7). Within groups, the proportion of principal operators who were new farmers varied, with Asian principal operators having the largest percentage who had been on their operation less than ten years (42 percent).
Table 7
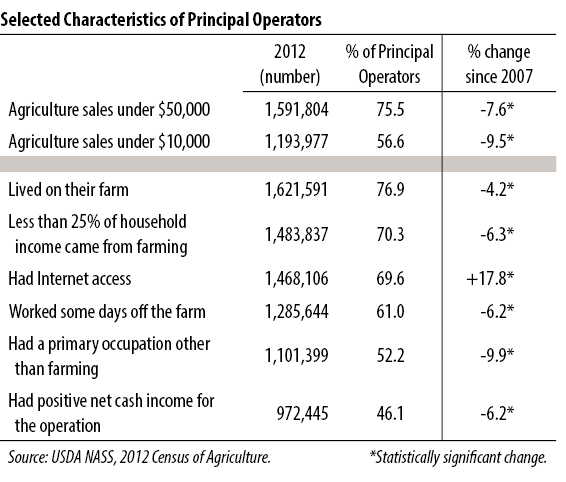
Snapshot of U.S. Farmers, 2012
The majority of the nation’s 2.1 million farms are small in terms of sales; 75 percent sold less than $50,000 in agricultural products in 2012 and 57 percent had sales less than $10,000. The farm is the place of residence for three fourths of principal operators, but it does not provide the majority of their household income. For 1.5 million farm households, less than 25 percent of household income came from their farm. In 2012, 61 percent worked off the farm at least some days, and 40 percent worked off the farm for 200 or more days.

About the Census of Agriculture
The Census of Agriculture is the leading source of facts and figures about American agriculture. The 2012 Census results provide information at national, state, and county levels about what agricultural products were raised in the United States in 2012, as well as where, how, and by whom.
To learn more about statistical significance and Census methodology, see frequently asked questions.
For easy-to-use tools that help both professional and casual users find and use the data, go to www.nass.usda.gov/AgCensus.
Last Modified: 09/04/2018