- Data & Statistics
Access Quick Stats (searchable database)
The Quick Stats Database is the most comprehensive tool for accessing agricultural data published by NASS. It allows you to customize your query by commodity, location, or time period.
Access Quick Stats Lite
Quick Stats Lite provides a more structured approach to get commonly requested statistics from our online database.
Explore Statistics
County Level Information
Geospatial Data & Interactive Maps
- Publications
Browse NASS Reports
- by Subject
- by Date (Reports Calendar)
- by Title/Release Day
- by Keyword
- Guide to Products and Services
Additional Reports
Historical Publications
- Archived Ag Census Reports (2002 and prior - published every 5 years)
- Annual Agricultural Statistics
- Statistical Bulletins (final estimates, 1987 to 2012
- Track Records: (crops, livestock, grain stocks)
- Trends 20th century
- Price Reactions (after crop or livestock reports)
Receive Reports by Email:
- Newsroom
News Releases
07/24/26 United States Cattle Inventory Up Slightly
06/30/26 Corn planted acreage down 3% from 2025, soybean acreage up 5% from last year
06/25/26 United States Hog Inventory Down Slightly
05/29/26 USDA to Gather Agricultural Conservation Data to Assess Trends and Improve Programs and Services
05/13/26 USDA requests producer input to support transparent reporting of 2026 crops, inventories, and values
Read More News
ASB Notices
06/22/26 NASS Adds Additional Counties to the 2025 Cotton County-level Estimates
12/22/25 USDA NASS reschedules reports due to December 24 & 26 government closure
11/19/25 USDA Reschedules Reports Affected by Lapse in Federal Funding
10/31/25 USDA’s National Agricultural Statistics Service (NASS) will release key data in November
08/28/25 NASS discontinues select data collection programs and reports
Read More Notices
Videos
02/13/24 2022 Census of Agriculture Data Highlights
02/13/24 How to Find 2022 Census of Agriculture Data
02/13/24 2022 Census of Agriculture Data Release Event
07/16/21 What is a Farm?
08/05/20 The NASS Mission: We do it for you
View More Videos
ASB Briefings
07/24/26 Cattle (July 2026)
07/10/26 Crop Production (July 2026)
06/30/26 Acreage and Grain Stocks (June 2026)
06/25/26 Quarterly Hogs and Pigs (June 2026)
06/11/26 Crop Production (June 2026)
View More Briefings
- Surveys
- Census
- About NASS
Structure and Organization
- Agency Overview
- NASS Biographies
- Organizational Chart
- Assistance to Other Organizations
- International Programs
- Talking About NASS - A guide for partners and stakeholders
- NASS Strategic Plan for FY 2022-2026
- USDA Strategic Goals
Guiding Principles
- Mission and Core Values
- Keeping Data Safe
- Confidentiality Pledge
- Security Pledge
- Security Statement
- Statement of Commitment to Scientific Integrity
- Regulations Guiding NASS
- Information Quality
- Learning Agenda, Fiscal Year 2024 -2026
Civil Rights
Work at NASS
Education and Outreach
- Understanding Ag Statistics
- Data Users' Meetings
- Morris Hansen Lecture
- International Conference on Agricultural Statistics
History and Procedures
- Agricultural Statistics Board and Lockup
- Agricultural Statistics: A Historical Timeline
- The Story of U.S. Agricultural Estimates
- As We Recall: The Growth of Agricultural Estimates, 1933-1961
-
Safeguarding America's Agricultural Statistics Report and Video
- History of Ag Statistics
- Report Procedures
- An Evolving Statistical Service
- Fact Finders for Agriculture
- Hall of Fame
- Contact Us
Mailing Address:
USDA-NASS
1400 Independence Ave., SW
Washington, DC 20250Survey FAQs and Contact Us:
Access FAQs or submit a question.
Data Inquiries:
Hours: 8:00 a.m. - 5:00 p.m. Central Standard Time
Monday - Friday, except federal holidays
Toll-Free: (800) 727-9540Media Inquiries:
Other USDA Inquiries:
Hours: Monday to Friday 8 a.m. - 5 p.m. EST
Toll-Free: (833) One-USDA
Email: askusda@usda.gov
Website: https://ask.usda.gov/s/Translation Services:
Regional and State Field Offices:
Find contact information for Regional and State Field Offices
Ask a Specialist:
Have a specific question for one of our subject experts? Contact a specialist.
Web Content Publishing Schedule:
Section 207(f)(2) of the E-Government Act of 2002 requires federal agencies to develop an inventory of information to be published on their Web sites, establish a schedule for publishing information, make those schedules available for public comment, and post the schedules and priorities on the Web site.
- Help
Technical Issues
Research and Science
Disaster Analysis 2019
NASS can now monitor agricultural disasters in near real-time and provide quantitative assessments using remotely sensed data and geospatial techniques. This page provides disaster assessments in geospatial data format, reports, and metadata as available. A flood monitoring methodology paper is located here.
- Kincade Fire
- Hurricane Dorian
- Tropical Storm Barry
- Missouri River Long-Term Flood Analysis
- Missouri and Illinois Flooding
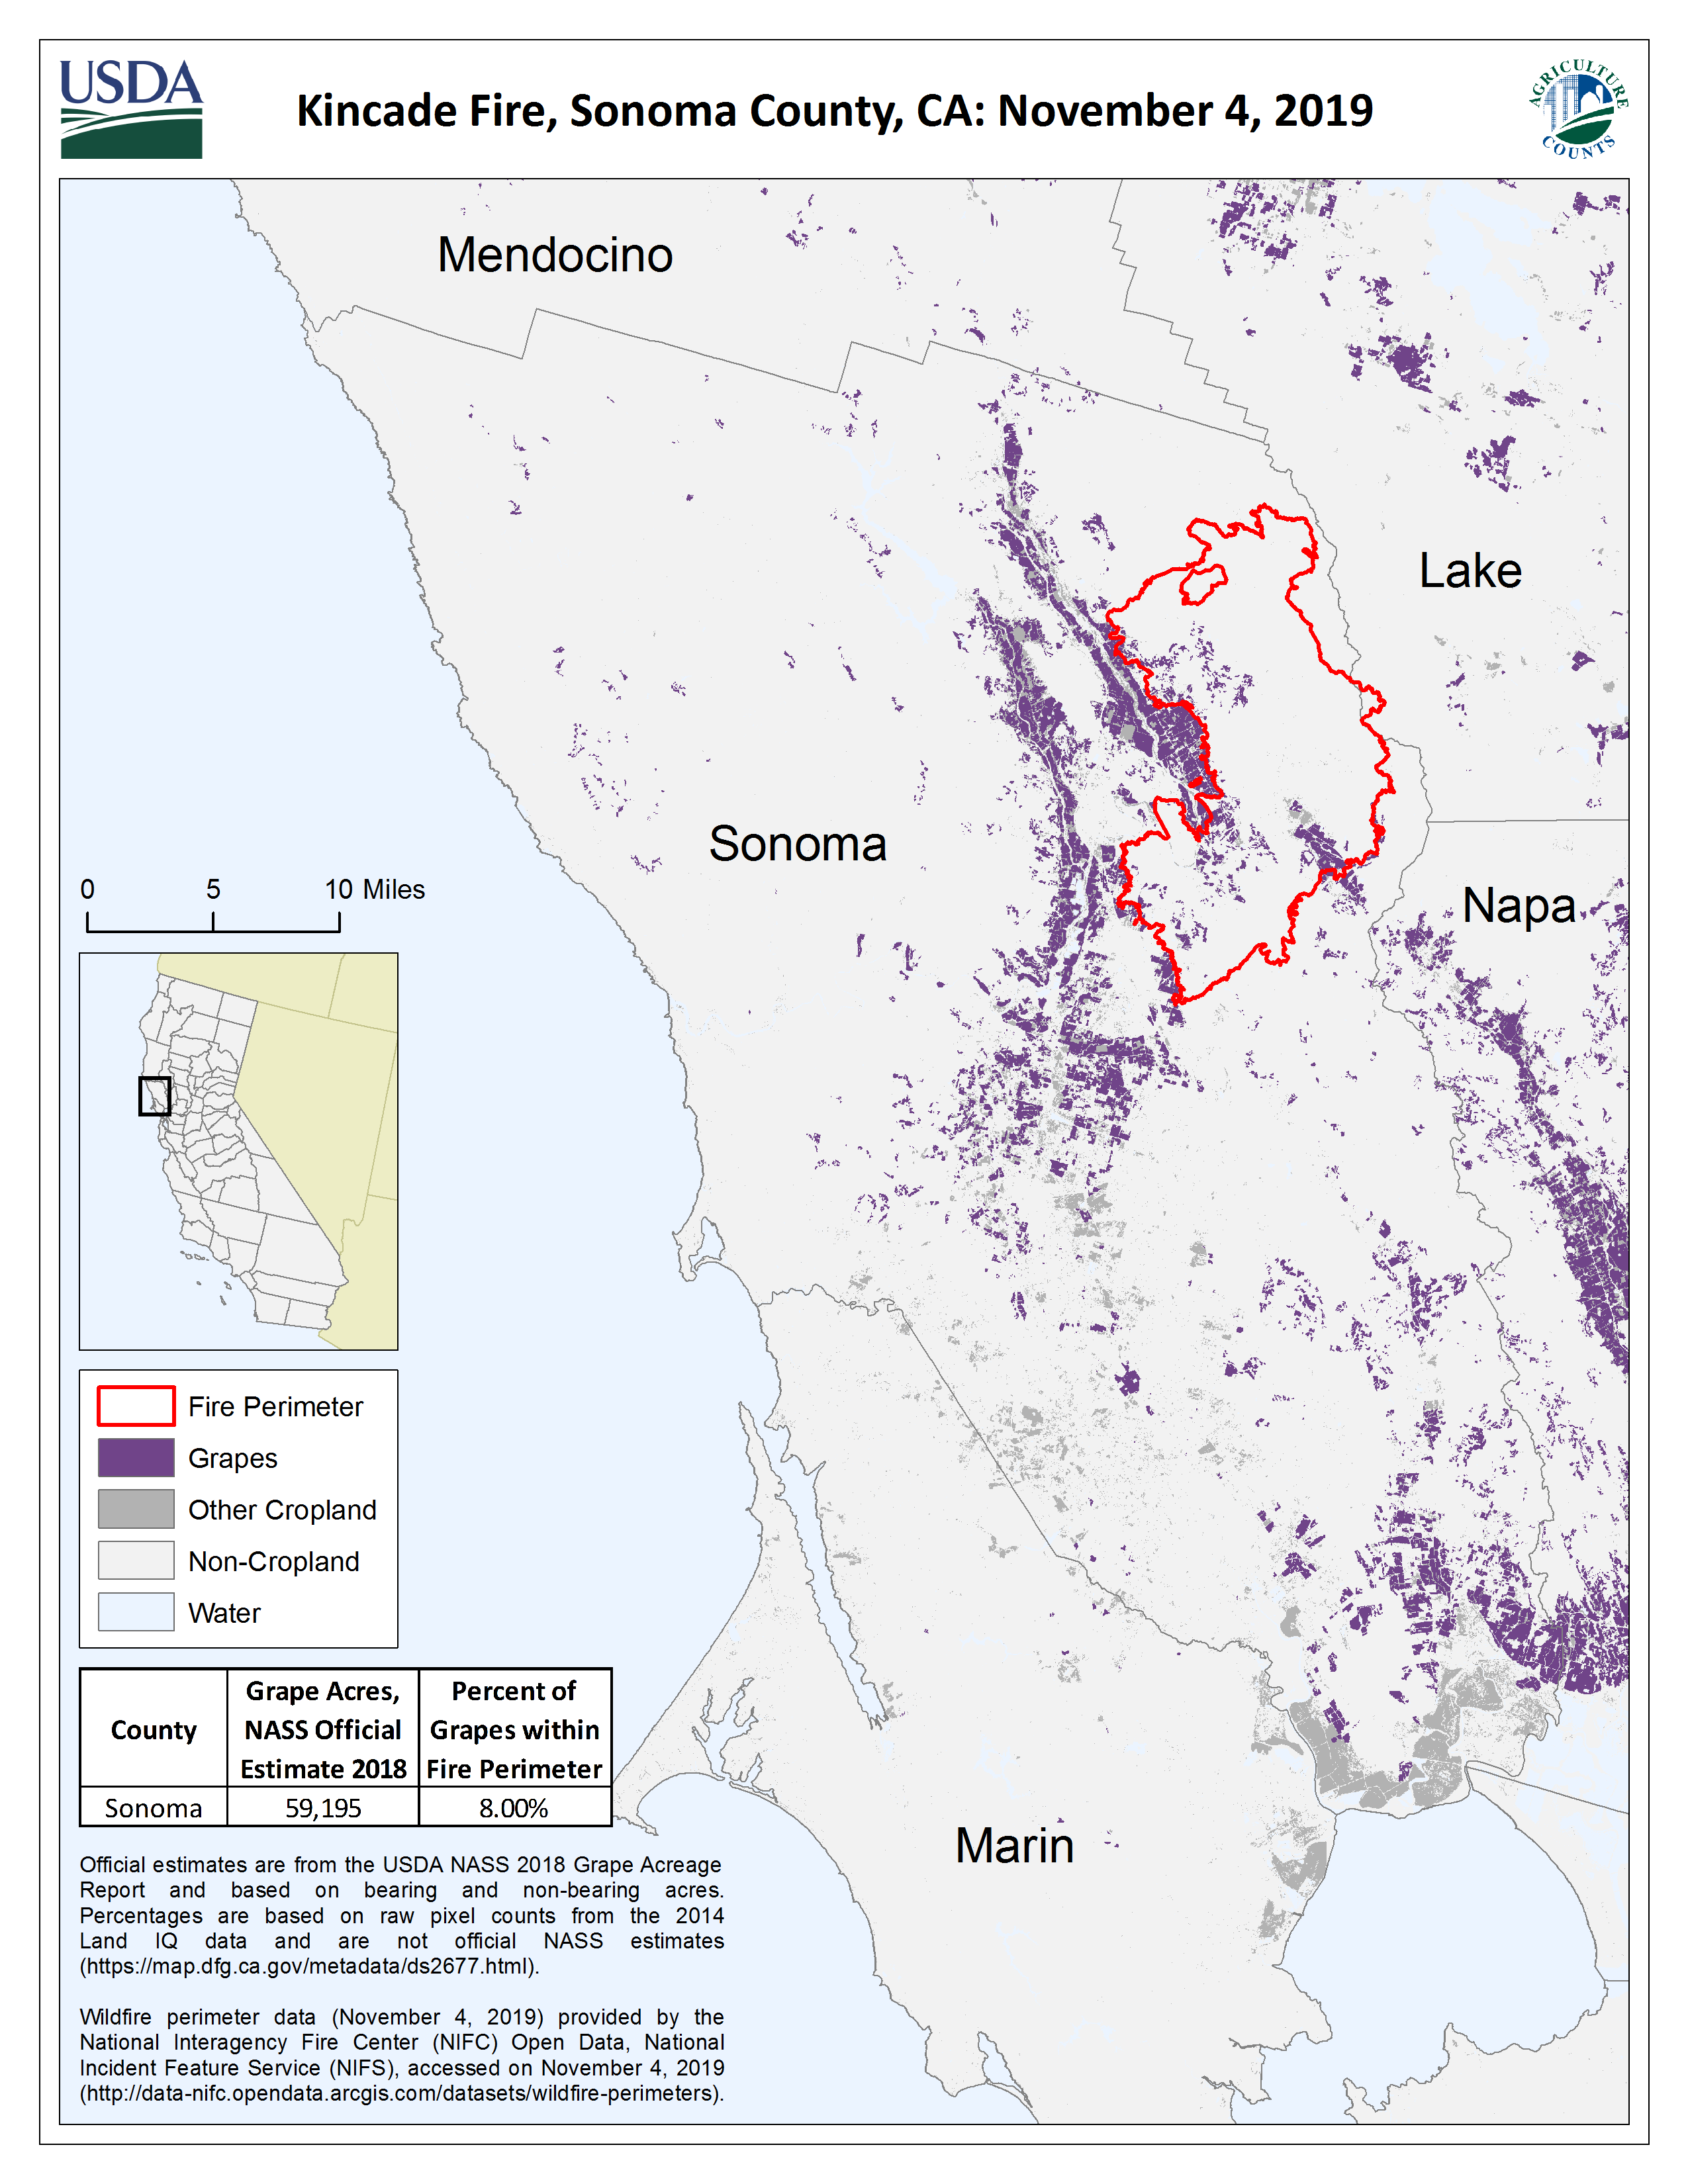
Kincade Fire (October-November 2019)
From October 23, 2019 to November 6, 2019, the Kincade Fire burned in Sonoma County, California, ignited during an extreme wind event. As of November 6, it was the largest wildfire in the 2019 California wildfire season, and largest ever to occur in Sonoma County. The United States Department of Agricultural National Agricultural Statistics Service (NASS) responded to inquiries of burned grape vines when the fire was near containment. Active fire location polygon data from the National Interagency Fire Center (NIFC) Open Data National Incident Feature Service (NIFS) was obtained on November 4, 2019, and combined with 2014 Land IQ raster data that identified land cover. The resulting map shows the percent of grapes within the Kincade Fire perimeter.
Files available for download: Synopsis
Download higher resolution map: PNG | PDF
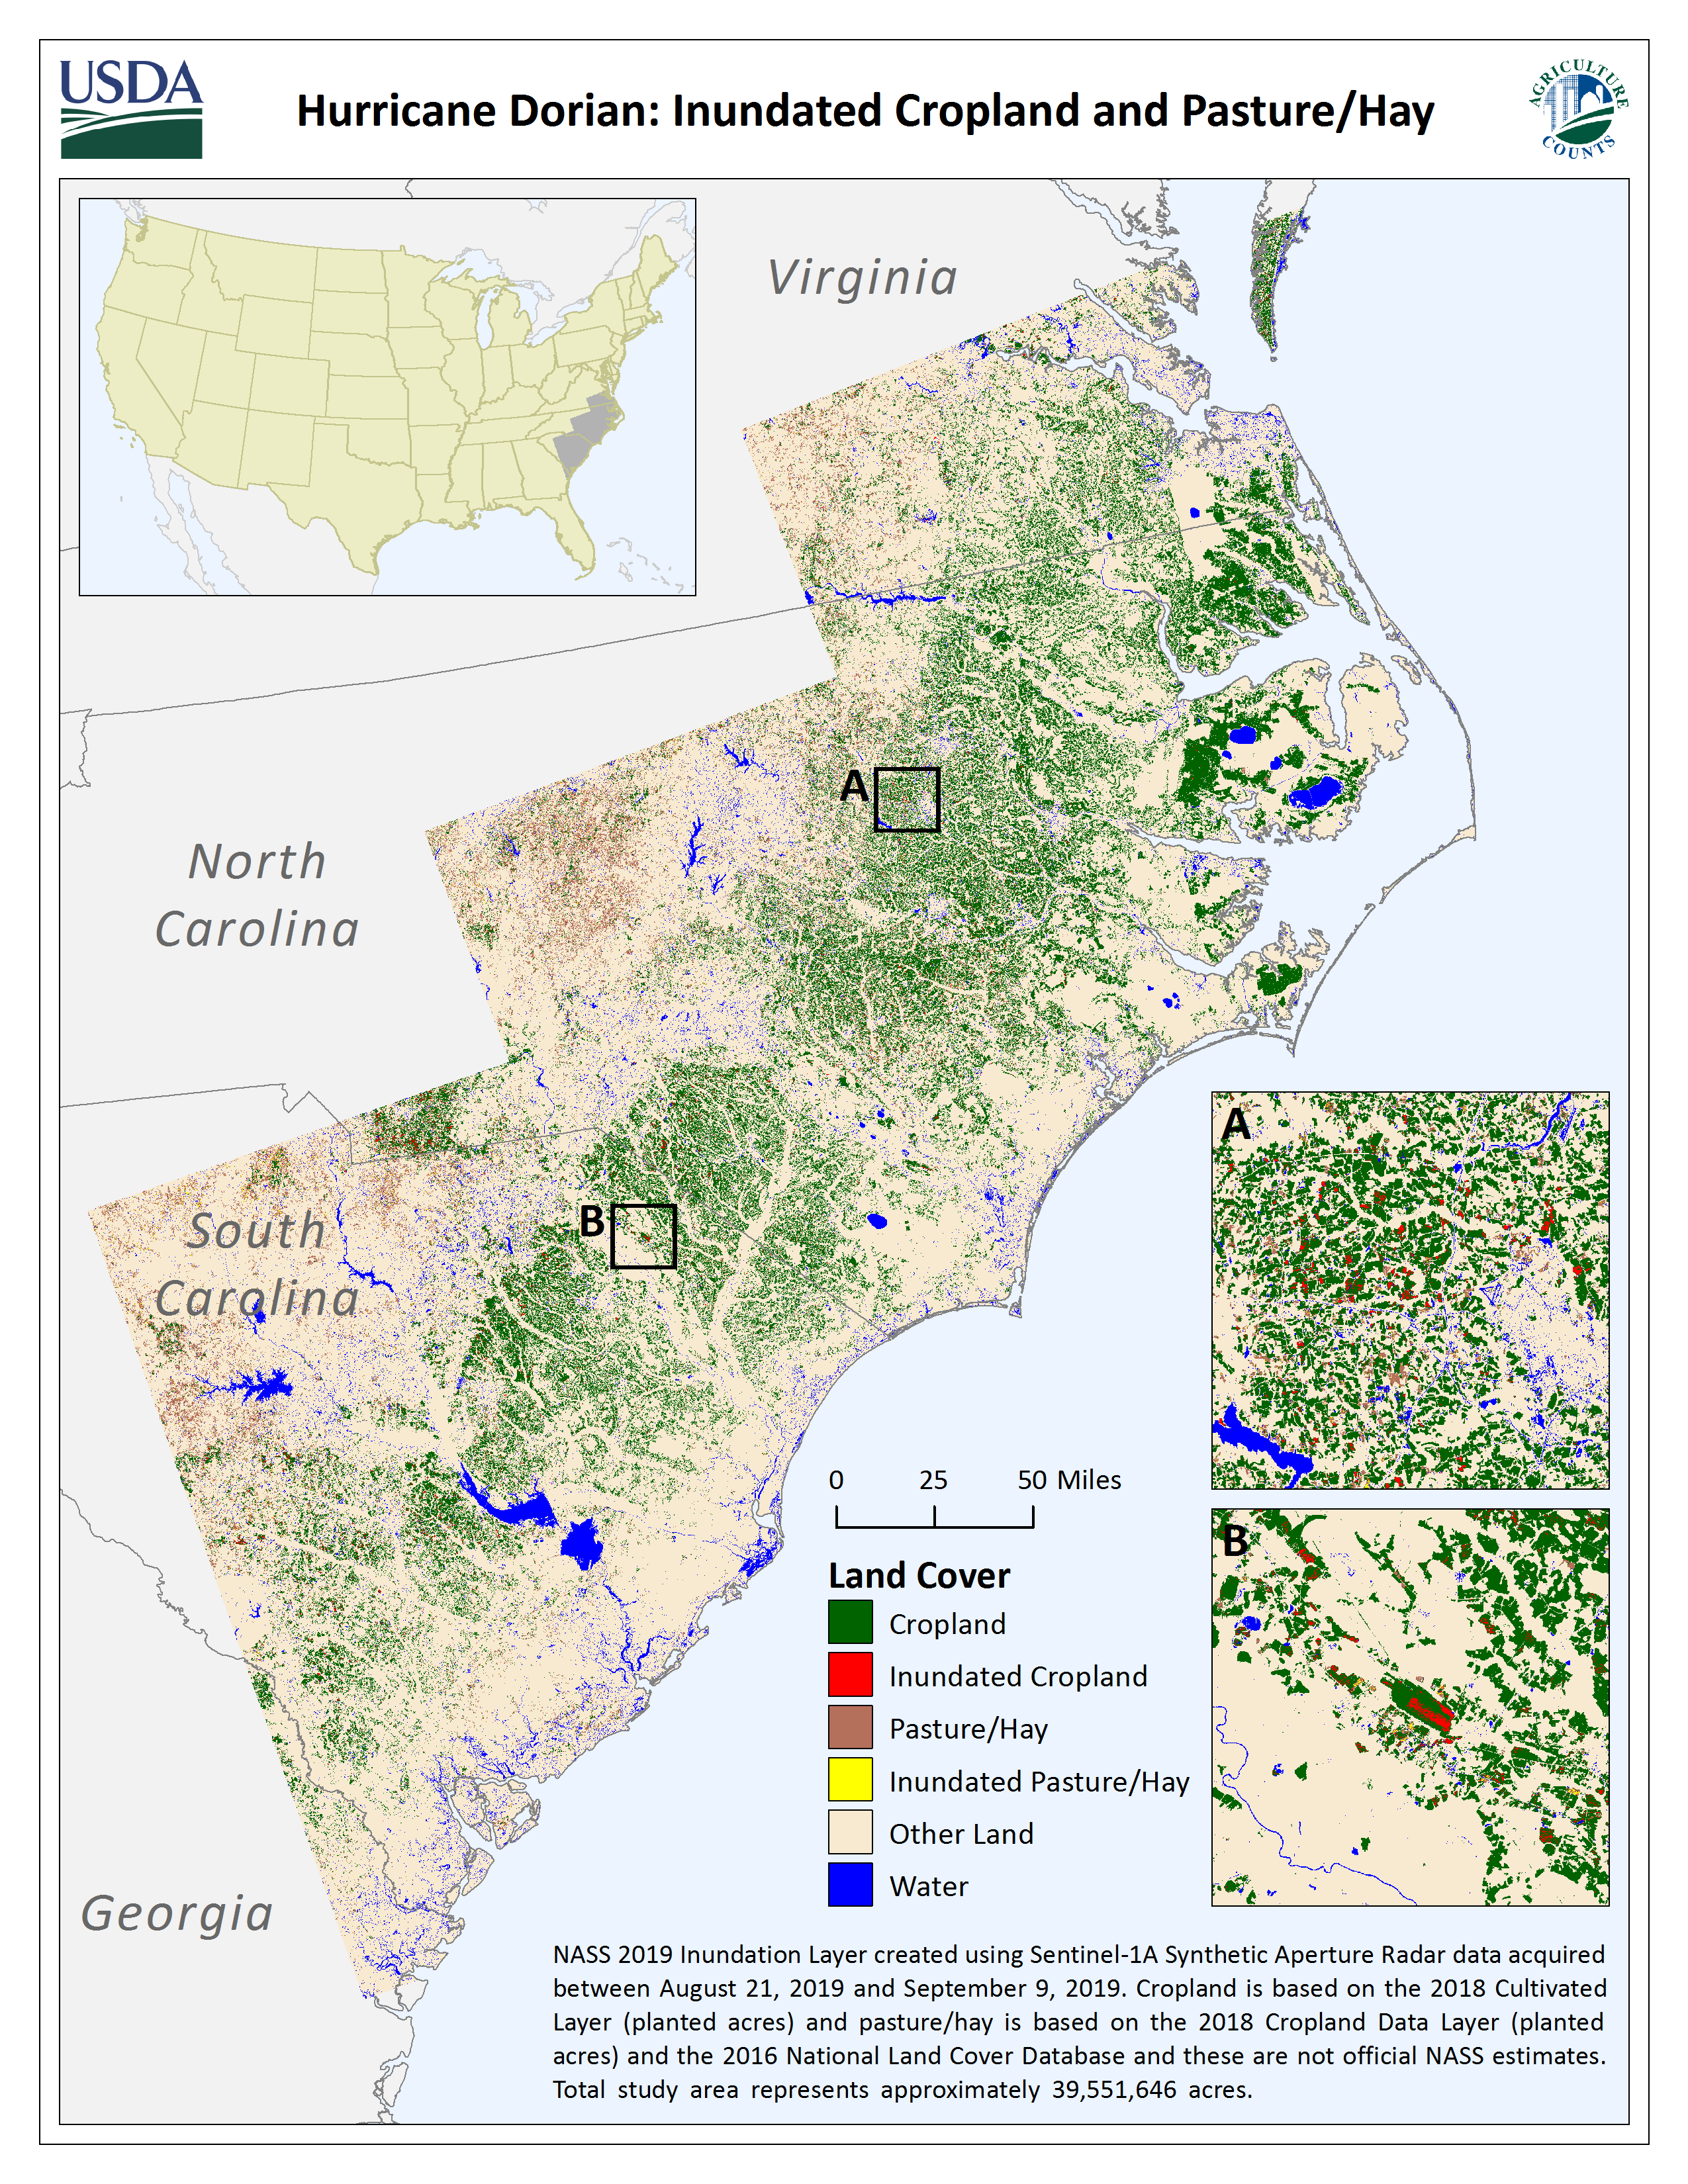
Hurricane Dorian (September 2019)
Hurricane Dorian impacted areas of the eastern United States, including Florida, Georgia, South Carolina, North Carolina, and Virginia from September 3 – 7, 2019 with heavy rainfall, strong winds, and storm surges. The United States Department of Agriculture's National Agricultural Statistics Service (NASS) responded to inquiries regarding the extent of flooding from Hurricane Dorian over agricultural land in near-real time. Consequently, a flood mapping procedure, based on Copernicus Sentinel-1 Synthetic Aperture Radar data and the NASS Cropland Data Layer, was implemented in response to the flood event. The data, maps, and reports below identify the extent of inundation over cropland and pasture based on this analysis. The crop inundation layers are publically available for download.
Files available for download: Assessment Report | Raster Data Zipfile | Wind Swath Zipfile | Synopsis | Metadata
Download higher resolution map: PNG | PDF
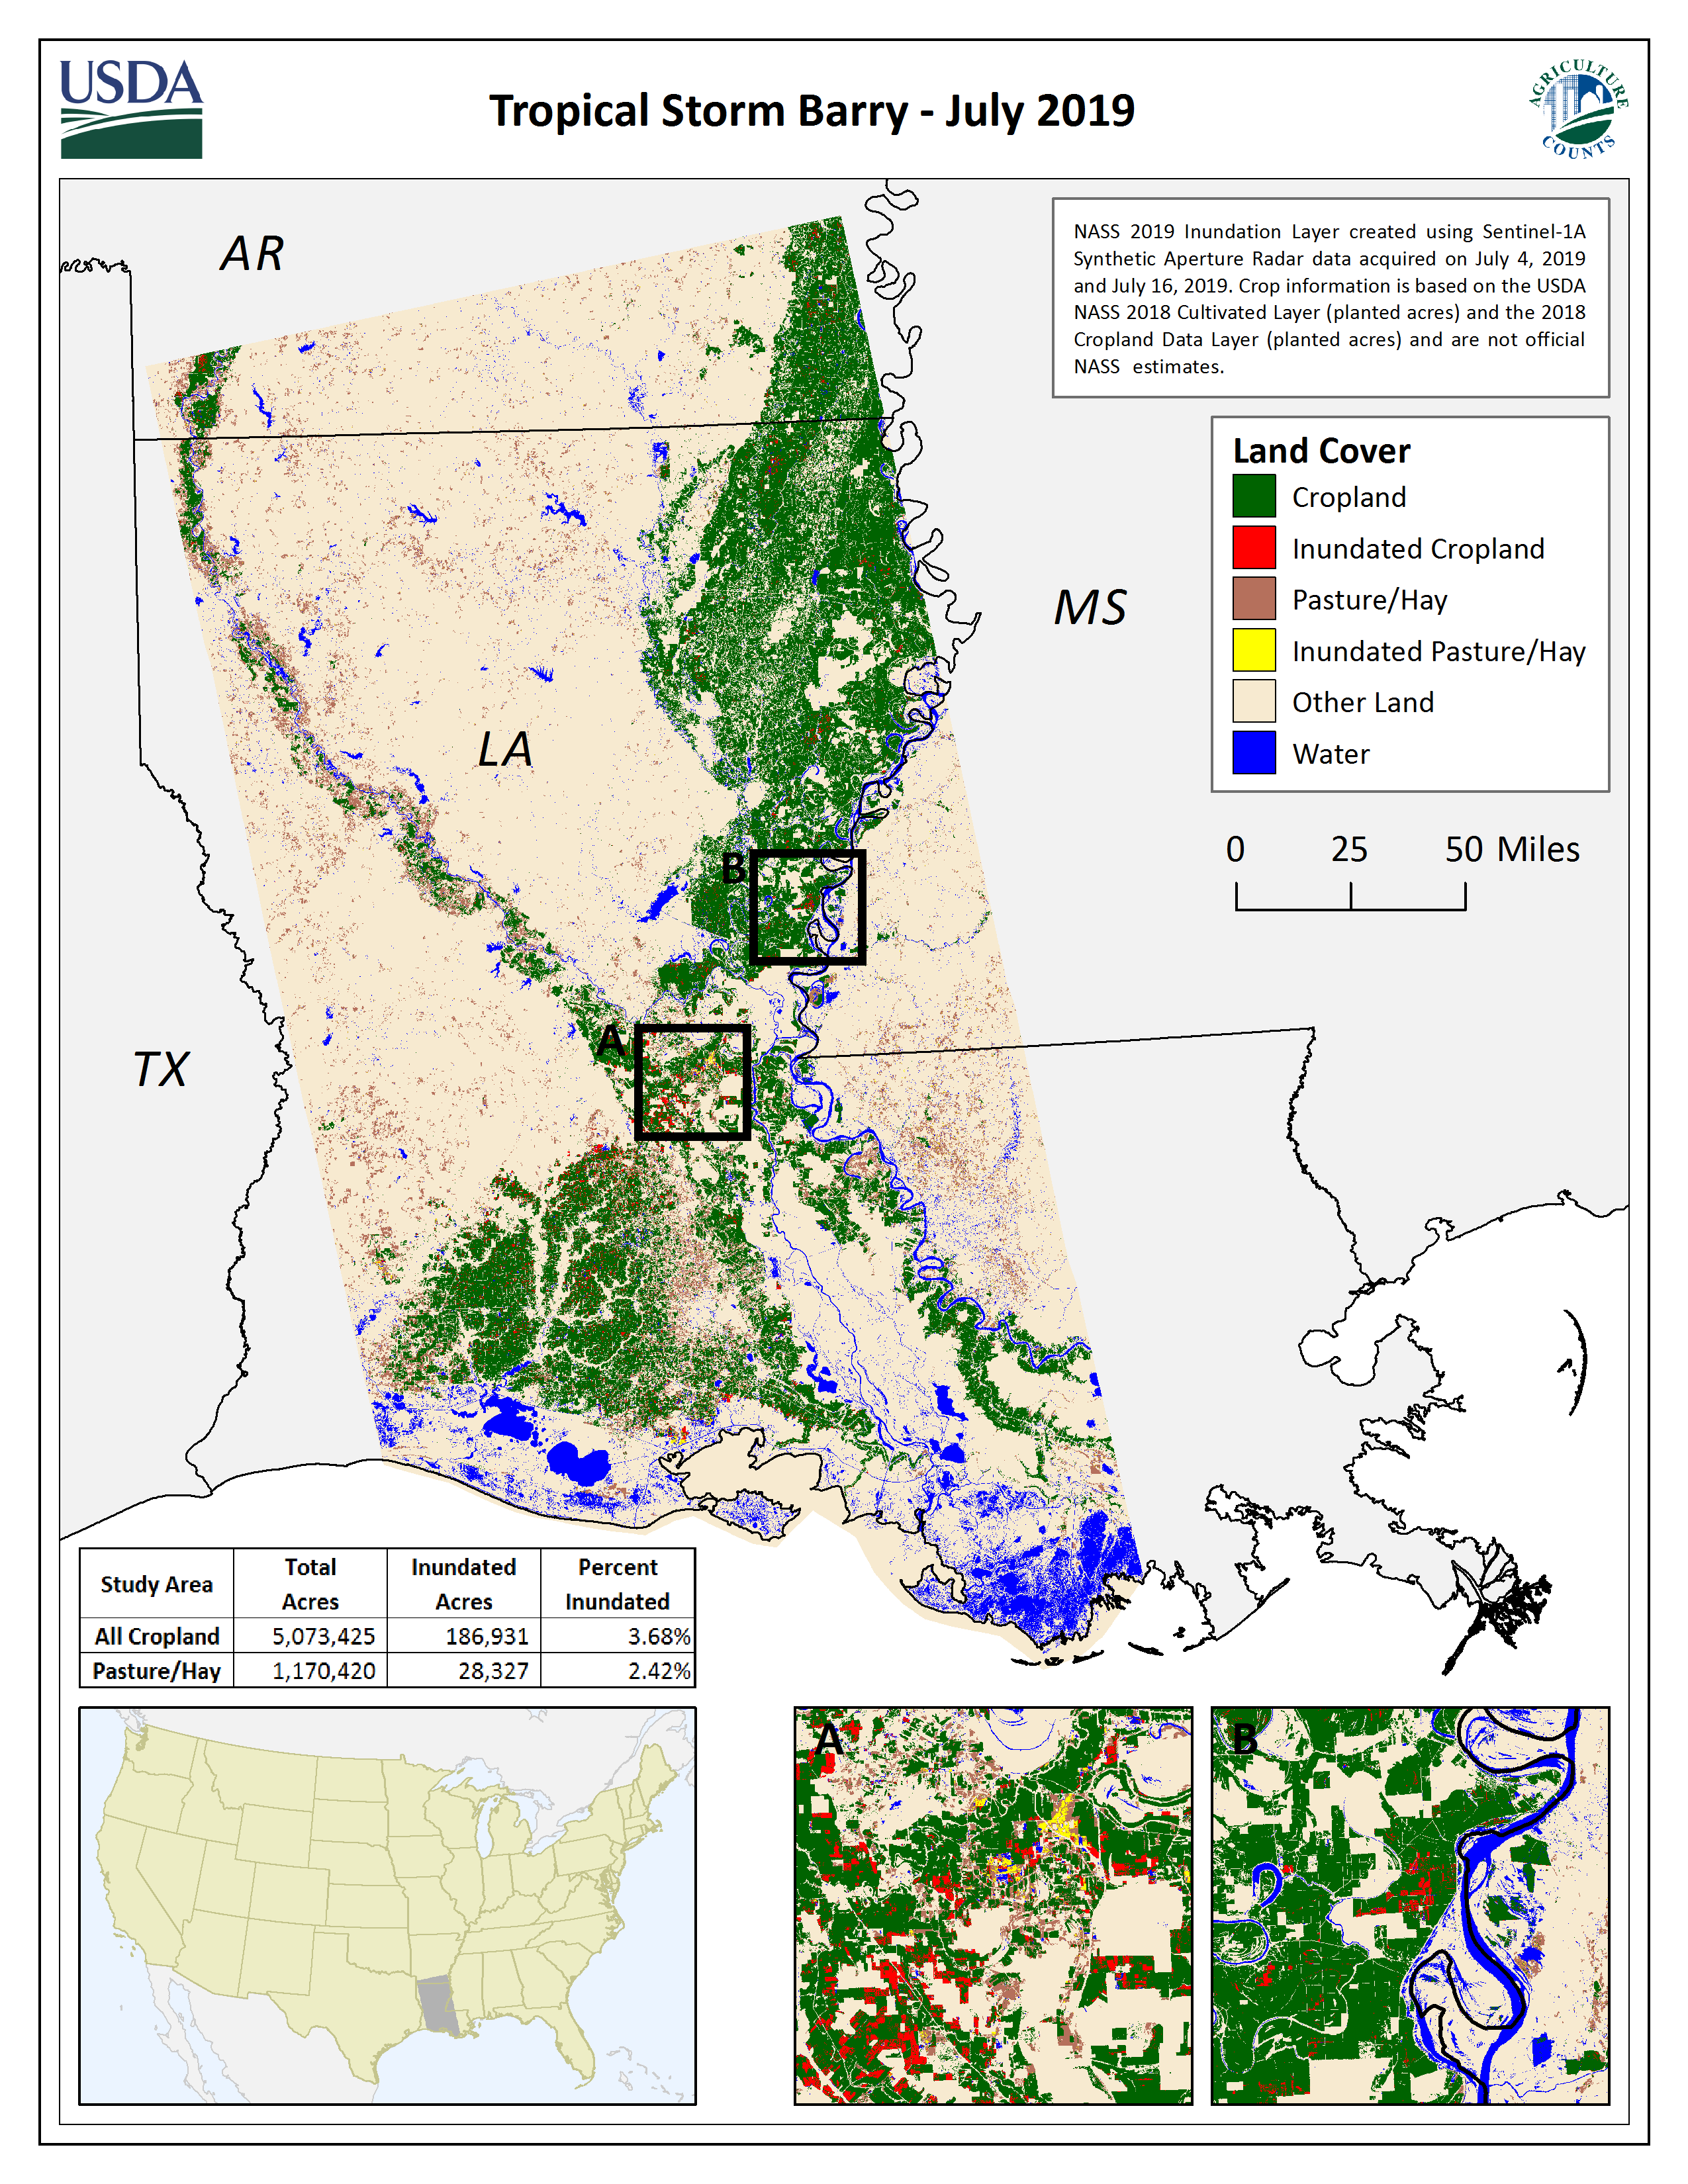
Tropical Storm Barry (July 2019)
Tropical Storm Barry impacted areas of Louisiana, eastern Arkansas, western Tennessee, southeast Missouri, and northwest Mississippi, United States from July 12 – 15, 2019 with heavy rainfall, strong winds and storm surges. The United States Department of Agriculture's National Agricultural Statistics Service (NASS) responded to inquiries regarding the extent of flooding from Tropical Storm Barry over agricultural land in near real-time. Consequently, a recently developed flood mapping procedure, based on Copernicus Sentinel-1 Synthetic Aperture Radar data and the NASS Cropland Data Layer, was implemented in response to the flood event. The data, maps, and reports below identify the extent of inundation over cropland and pasture based on this analysis. There are several causes for anomalous water, which could include flooding, saturated fields from rainfall, ponding, or intentionally flooded rice and aquaculture fields. The crop inundation layers are publically available for download.
Files available for download: Assessment Report | Raster Data Zipfile | Synopsis | Metadata
Download higher resolution map: PNG | PDF
Missouri River Long-Term Flood Analysis (April/May/June 2019)
During the spring of 2019, the Missouri River Valley experienced heavy spring rains that breached several levies. These prolonged weather events presented an ongoing struggle to understand how many acres of agricultural land were affected in Kansas and Nebraska along the Missouri River. Multi-month flooding analysis was performed to compare the effects of these precipitation events. Using a Copernicus Sentinel-1 Synthetic Aperture Radar base image dated in October of the previous year, NASS determined inundated agricultural areas (as defined by the 2018 NASS Cropland Data Layer) for five dates ranging from April 4, 2019 to June 27, 2019. The data and maps below were shared with the State Emergency Boards in Kansas and Nebraska. The map shown below shows the first of five inundation maps created; all five inundation maps and datasets are available for download.
Files available for download: Synopsis | Metadata | Raster Data Zipfile | Maps (PDF) Zipfile | Maps (PNG) Zipfile

Download higher resolution map: PNG | PDF
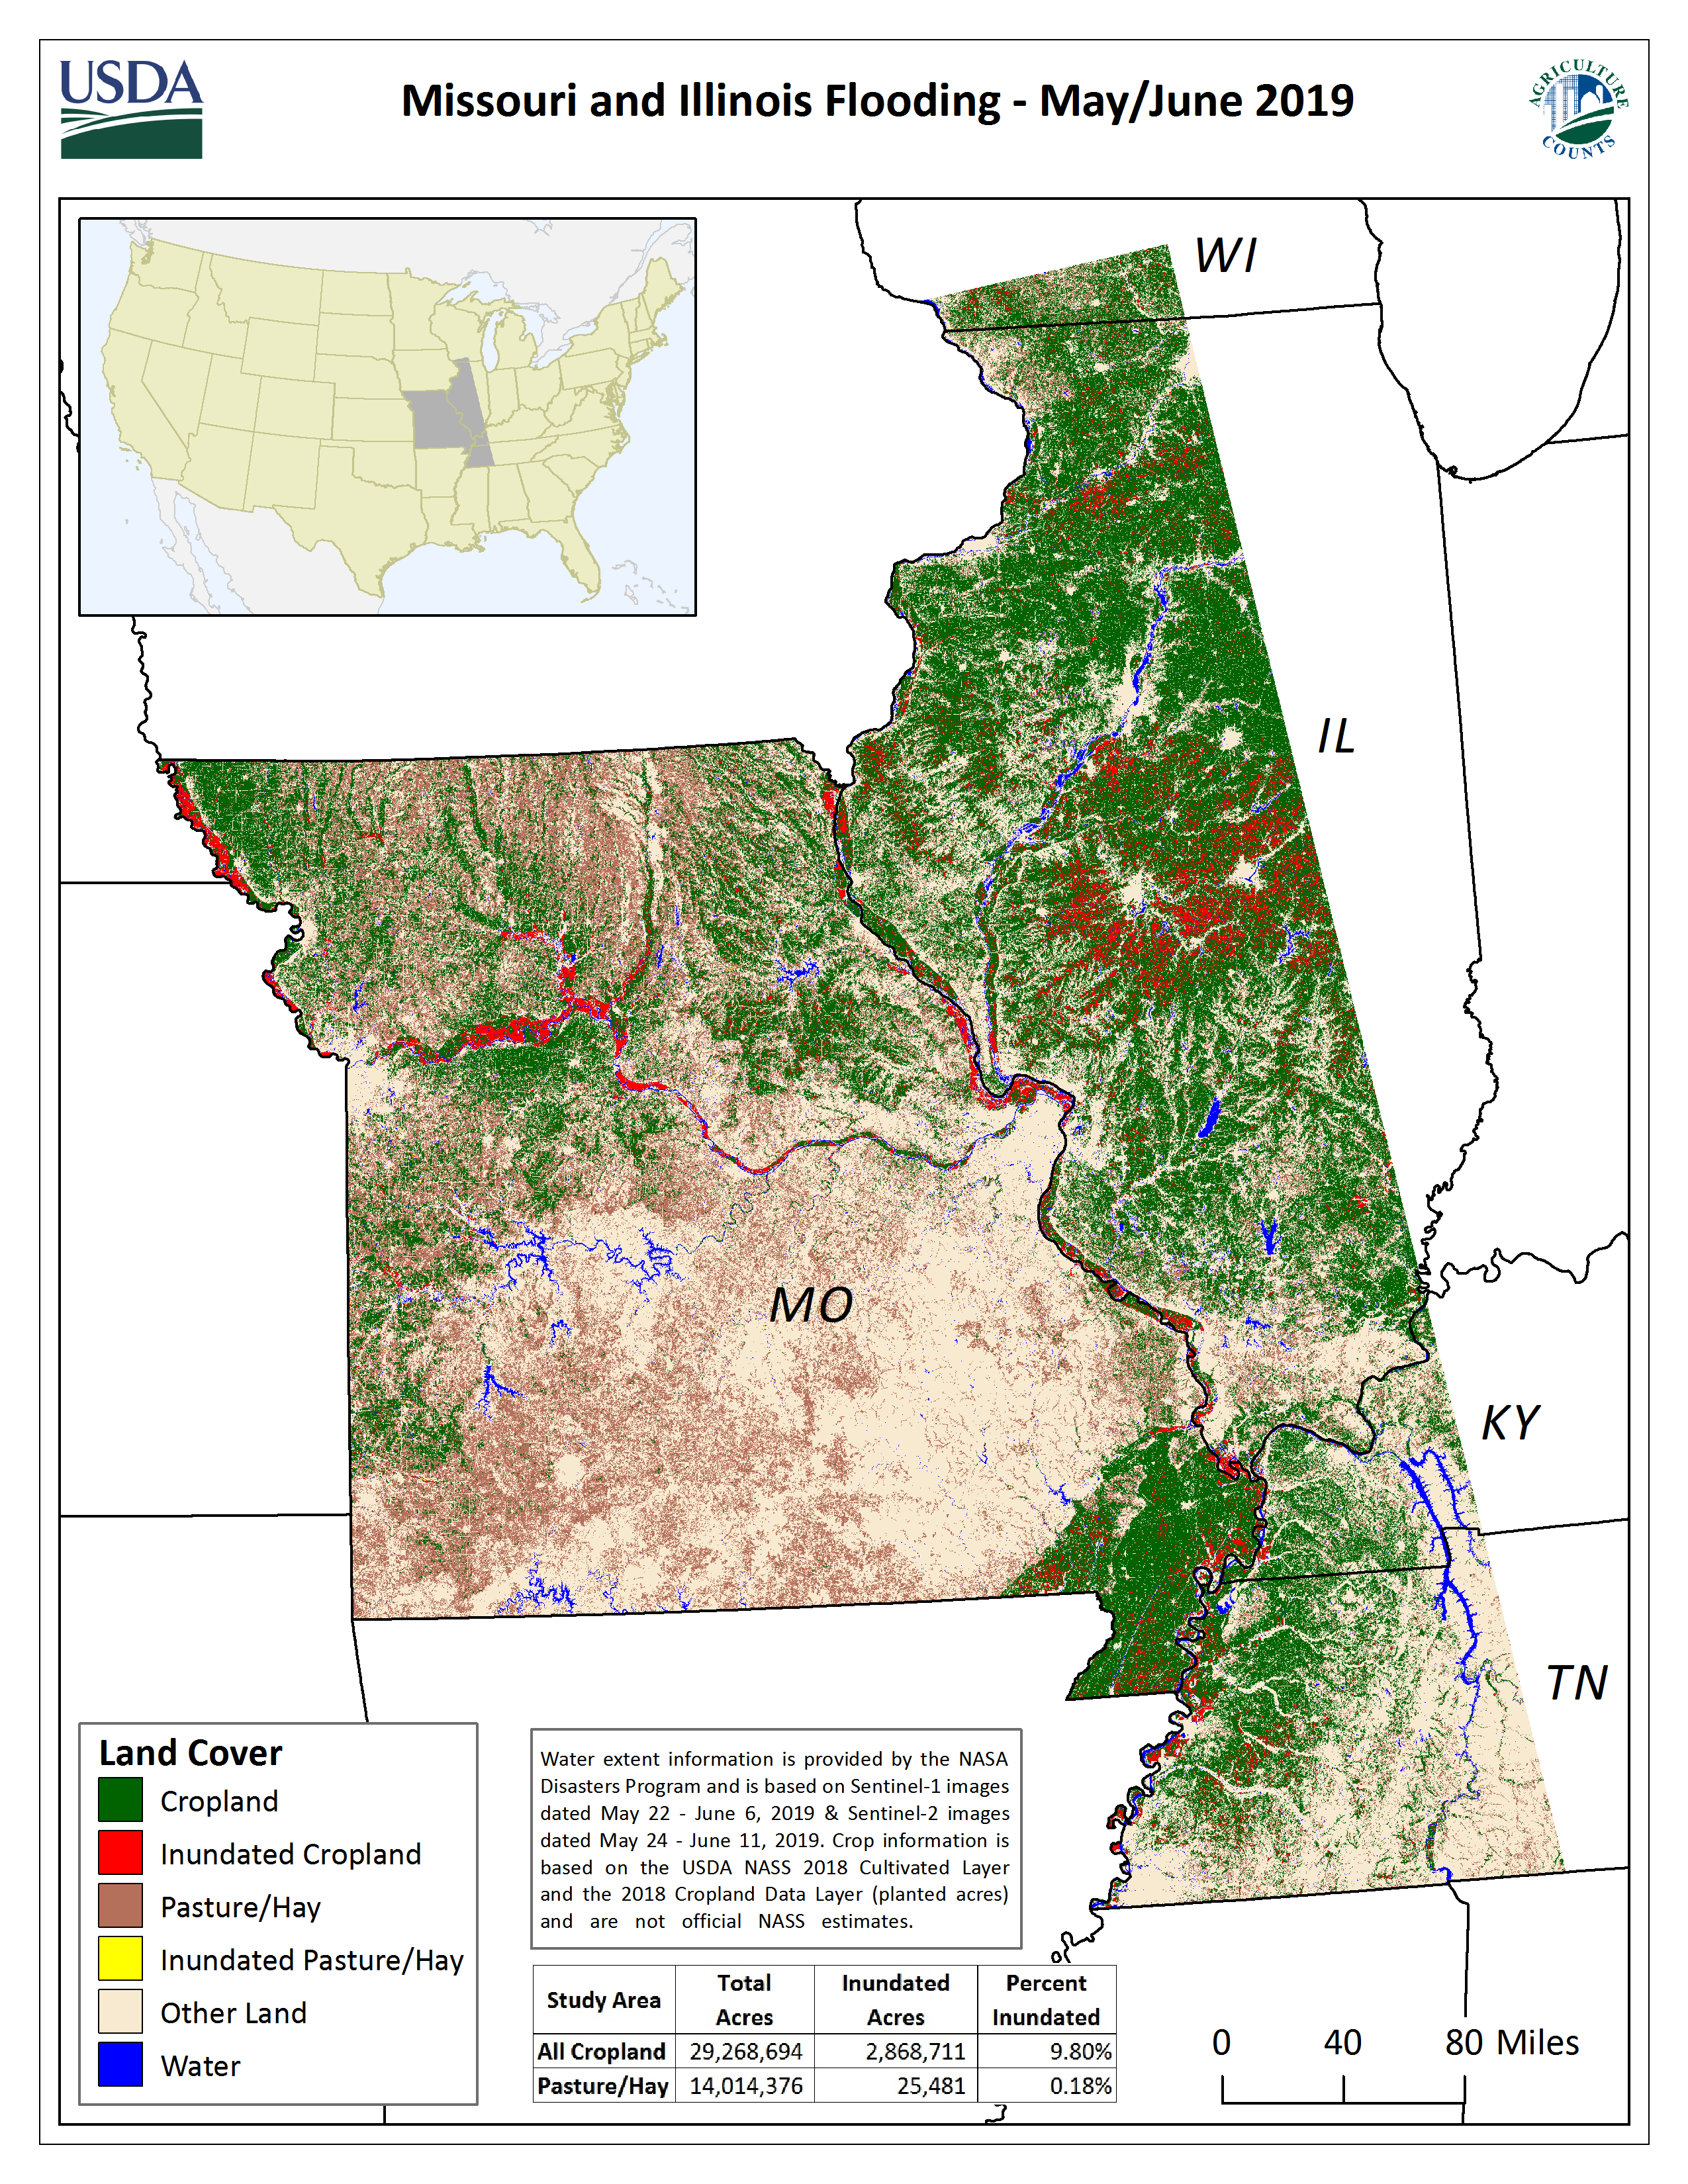
Missouri and Illinois Flooding (May/June 2019)
The central United States experienced severe flooding during late May and early June, 2019. The United States Department of Agriculture's National Agricultural Statistics Service (NASS) responded to inquiries regarding the extent of flooding over agricultural land in Missouri and surrounding states. Water extent data (dates ranging from May 22 to June 11) from the NASA Disasters Program were used to determine anomalous water over cropland and pasture areas as derived from the 2018 NASS Cropland Data Layer program. The data and maps below identify the extent of anomalous water over cropland and pasture based on these data. There are several causes for anomalous water, which could include flooding, saturated fields from rainfall, ponding, or intentionally flooded rice fields. The crop inundation layers are publically available for download.
Files available for download: Raster Data Zipfile | Synopsis | Metadata
Download higher resolution map: PNG | PDF
Previous Years:
Return to current yearLast Modified: 03/20/2024