- Data & Statistics
Access Quick Stats (searchable database)
The Quick Stats Database is the most comprehensive tool for accessing agricultural data published by NASS. It allows you to customize your query by commodity, location, or time period.
Access Quick Stats Lite
Quick Stats Lite provides a more structured approach to get commonly requested statistics from our online database.
Explore Statistics
County Level Information
Geospatial Data & Interactive Maps
- Publications
Browse NASS Reports
- by Subject
- by Date (Reports Calendar)
- by Title/Release Day
- by Keyword
- Guide to Products and Services
Additional Reports
Historical Publications
- Archived Ag Census Reports (2002 and prior - published every 5 years)
- Annual Agricultural Statistics
- Statistical Bulletins (final estimates, 1987 to 2012
- Track Records: (crops, livestock, grain stocks)
- Trends 20th century
- Price Reactions (after crop or livestock reports)
Receive Reports by Email:
- Newsroom
News Releases
06/30/26 Corn planted acreage down 3% from 2025, soybean acreage up 5% from last year
06/25/26 United States Hog Inventory Down Slightly
05/29/26 USDA to Gather Agricultural Conservation Data to Assess Trends and Improve Programs and Services
05/13/26 USDA requests producer input to support transparent reporting of 2026 crops, inventories, and values
03/31/26 US farmers expect to plant less corn and more soybean acres
Read More News
ASB Notices
06/22/26 NASS Adds Additional Counties to the 2025 Cotton County-level Estimates
12/22/25 USDA NASS reschedules reports due to December 24 & 26 government closure
11/19/25 USDA Reschedules Reports Affected by Lapse in Federal Funding
10/31/25 USDA’s National Agricultural Statistics Service (NASS) will release key data in November
08/28/25 NASS discontinues select data collection programs and reports
Read More Notices
Videos
02/13/24 2022 Census of Agriculture Data Highlights
02/13/24 How to Find 2022 Census of Agriculture Data
02/13/24 2022 Census of Agriculture Data Release Event
07/16/21 What is a Farm?
08/05/20 The NASS Mission: We do it for you
View More Videos
ASB Briefings
07/10/26 Crop Production (July 2026)
06/30/26 Acreage and Grain Stocks (June 2026)
06/25/26 Quarterly Hogs and Pigs (June 2026)
06/11/26 Crop Production (June 2026)
05/12/26 Crop Production (May 2026)
View More Briefings
- Surveys
- Census
- About NASS
Structure and Organization
- Agency Overview
- NASS Biographies
- Organizational Chart
- Assistance to Other Organizations
- International Programs
- Talking About NASS - A guide for partners and stakeholders
- NASS Strategic Plan for FY 2022-2026
- USDA Strategic Goals
Guiding Principles
- Mission and Core Values
- Keeping Data Safe
- Confidentiality Pledge
- Security Pledge
- Security Statement
- Statement of Commitment to Scientific Integrity
- Regulations Guiding NASS
- Information Quality
- Learning Agenda, Fiscal Year 2024 -2026
Civil Rights
Work at NASS
Education and Outreach
- Understanding Ag Statistics
- Data Users' Meetings
- Morris Hansen Lecture
- International Conference on Agricultural Statistics
History and Procedures
- Agricultural Statistics Board and Lockup
- Agricultural Statistics: A Historical Timeline
- The Story of U.S. Agricultural Estimates
- As We Recall: The Growth of Agricultural Estimates, 1933-1961
-
Safeguarding America's Agricultural Statistics Report and Video
- History of Ag Statistics
- Report Procedures
- An Evolving Statistical Service
- Fact Finders for Agriculture
- Hall of Fame
- Contact Us
Mailing Address:
USDA-NASS
1400 Independence Ave., SW
Washington, DC 20250Survey FAQs and Contact Us:
Access FAQs or submit a question.
Data Inquiries:
Hours: 8:00 a.m. - 5:00 p.m. Central Standard Time
Monday - Friday, except federal holidays
Toll-Free: (800) 727-9540Media Inquiries:
Other USDA Inquiries:
Hours: Monday to Friday 8 a.m. - 5 p.m. EST
Toll-Free: (833) One-USDA
Email: askusda@usda.gov
Website: https://ask.usda.gov/s/Translation Services:
Regional and State Field Offices:
Find contact information for Regional and State Field Offices
Ask a Specialist:
Have a specific question for one of our subject experts? Contact a specialist.
Web Content Publishing Schedule:
Section 207(f)(2) of the E-Government Act of 2002 requires federal agencies to develop an inventory of information to be published on their Web sites, establish a schedule for publishing information, make those schedules available for public comment, and post the schedules and priorities on the Web site.
- Help
Technical Issues
Charts and Maps
Crop Progress and Condition
Crop Progress and Condition graphical products are available for the following years:
Crop Progress and Condition graphical products are shown in the following example for the 2008 US corn crop throughout the key stages of its phenological cycle. The progress of the crop through each stage is shown as a percentage in the lower third of the graphic. Condition Ratings are shown in the middle part of the graphic and the sum of good plus excellent condition for the current year and the previous four years are shown in the top third. This product is generated in most states and will include the major commodities reported in each state. Separate pages are embedded in the .PDF file, in alphabetical order, for each commodity.
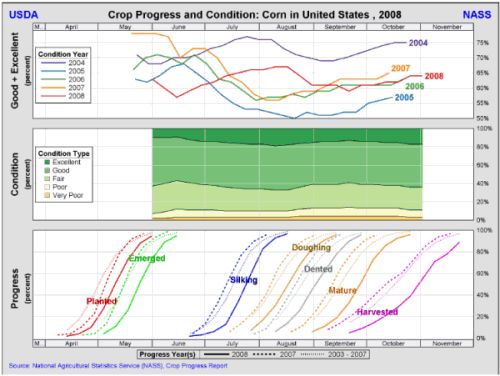
The Crop Progress percent values show the cumulative progress for each crop at key stages and are identical to the published values. The Crop Condition are stacked and always sum to 100. Current year progress lines are identified by the bold lines, the previous year progress lines are dashed, and the previous 5-year averages are identified by the dotted lines. All charts for a particular growing season are standardized using the same range of dates to facilitate the comparison of progress and condition for different crops grown during the same season. A vertical dashed reference line through all three charts identifies the most recent week ending crop progress reference date.
Please click here for the definitions of the phenological stages and condition categories.