- Data & Statistics
Access Quick Stats (searchable database)
The Quick Stats Database is the most comprehensive tool for accessing agricultural data published by NASS. It allows you to customize your query by commodity, location, or time period.
Access Quick Stats Lite
Quick Stats Lite provides a more structured approach to get commonly requested statistics from our online database.
Explore Statistics
County Level Information
Geospatial Data & Interactive Maps
- Publications
Browse NASS Reports
- by Subject
- by Date (Reports Calendar)
- by Title/Release Day
- by Keyword
- Guide to Products and Services
Additional Reports
Historical Publications
- Archived Ag Census Reports (2002 and prior - published every 5 years)
- Annual Agricultural Statistics
- Statistical Bulletins (final estimates, 1987 to 2012
- Track Records: (crops, livestock, grain stocks)
- Trends 20th century
- Price Reactions (after crop or livestock reports)
Receive Reports by Email:
- Newsroom
News Releases
07/24/26 United States Cattle Inventory Up Slightly
06/30/26 Corn planted acreage down 3% from 2025, soybean acreage up 5% from last year
06/25/26 United States Hog Inventory Down Slightly
05/29/26 USDA to Gather Agricultural Conservation Data to Assess Trends and Improve Programs and Services
05/13/26 USDA requests producer input to support transparent reporting of 2026 crops, inventories, and values
Read More News
ASB Notices
06/22/26 NASS Adds Additional Counties to the 2025 Cotton County-level Estimates
12/22/25 USDA NASS reschedules reports due to December 24 & 26 government closure
11/19/25 USDA Reschedules Reports Affected by Lapse in Federal Funding
10/31/25 USDA’s National Agricultural Statistics Service (NASS) will release key data in November
08/28/25 NASS discontinues select data collection programs and reports
Read More Notices
Videos
02/13/24 2022 Census of Agriculture Data Highlights
02/13/24 How to Find 2022 Census of Agriculture Data
02/13/24 2022 Census of Agriculture Data Release Event
07/16/21 What is a Farm?
08/05/20 The NASS Mission: We do it for you
View More Videos
ASB Briefings
07/24/26 Cattle (July 2026)
07/10/26 Crop Production (July 2026)
06/30/26 Acreage and Grain Stocks (June 2026)
06/25/26 Quarterly Hogs and Pigs (June 2026)
06/11/26 Crop Production (June 2026)
View More Briefings
- Surveys
- Census
- About NASS
Structure and Organization
- Agency Overview
- NASS Biographies
- Organizational Chart
- Assistance to Other Organizations
- International Programs
- Talking About NASS - A guide for partners and stakeholders
- NASS Strategic Plan for FY 2022-2026
- USDA Strategic Goals
Guiding Principles
- Mission and Core Values
- Keeping Data Safe
- Confidentiality Pledge
- Security Pledge
- Security Statement
- Statement of Commitment to Scientific Integrity
- Regulations Guiding NASS
- Information Quality
- Learning Agenda, Fiscal Year 2024 -2026
Civil Rights
Work at NASS
Education and Outreach
- Understanding Ag Statistics
- Data Users' Meetings
- Morris Hansen Lecture
- International Conference on Agricultural Statistics
History and Procedures
- Agricultural Statistics Board and Lockup
- Agricultural Statistics: A Historical Timeline
- The Story of U.S. Agricultural Estimates
- As We Recall: The Growth of Agricultural Estimates, 1933-1961
-
Safeguarding America's Agricultural Statistics Report and Video
- History of Ag Statistics
- Report Procedures
- An Evolving Statistical Service
- Fact Finders for Agriculture
- Hall of Fame
- Contact Us
Mailing Address:
USDA-NASS
1400 Independence Ave., SW
Washington, DC 20250Survey FAQs and Contact Us:
Access FAQs or submit a question.
Data Inquiries:
Hours: 8:00 a.m. - 5:00 p.m. Central Standard Time
Monday - Friday, except federal holidays
Toll-Free: (800) 727-9540Media Inquiries:
Other USDA Inquiries:
Hours: Monday to Friday 8 a.m. - 5 p.m. EST
Toll-Free: (833) One-USDA
Email: askusda@usda.gov
Website: https://ask.usda.gov/s/Translation Services:
Regional and State Field Offices:
Find contact information for Regional and State Field Offices
Ask a Specialist:
Have a specific question for one of our subject experts? Contact a specialist.
Web Content Publishing Schedule:
Section 207(f)(2) of the E-Government Act of 2002 requires federal agencies to develop an inventory of information to be published on their Web sites, establish a schedule for publishing information, make those schedules available for public comment, and post the schedules and priorities on the Web site.
- Help
Technical Issues
Research and Science
Disaster Analysis 2021
NASS can now monitor agricultural disasters in near real-time and provide quantitative assessments using remotely sensed data and geospatial techniques. This page provides disaster assessments in geospatial data format, reports, and metadata as available. A flood monitoring methodology paper is located here.
- Kentucky Tornadoes
- Kansas Wildfires
- Hurricane Ida
- Western U.S. Drought and Extreme Heat Event
- Delta Region
Kentucky Tornadoes – December 2021
On December 10-11, 2021, a strong storm moved across the state of Kentucky and spawned several tornadoes which spanned a distance of over 165 miles. The United States Department of Agriculture's National Agricultural Statistics Service (NASS) responded to inquiries regarding the extent of cropland potentially affected by the Kentucky tornadoes in mid-December 2021. Tornado track location data was provided by the National Weather Service (NWS). Land cover information was derived from the NASS 2021 Cropland Data Layer which was released in February 2022. Analysis was conducted in March 2022.
Files available for download: Kentucky Tornadoes Synopsis | Tornado Map | Tornado Report
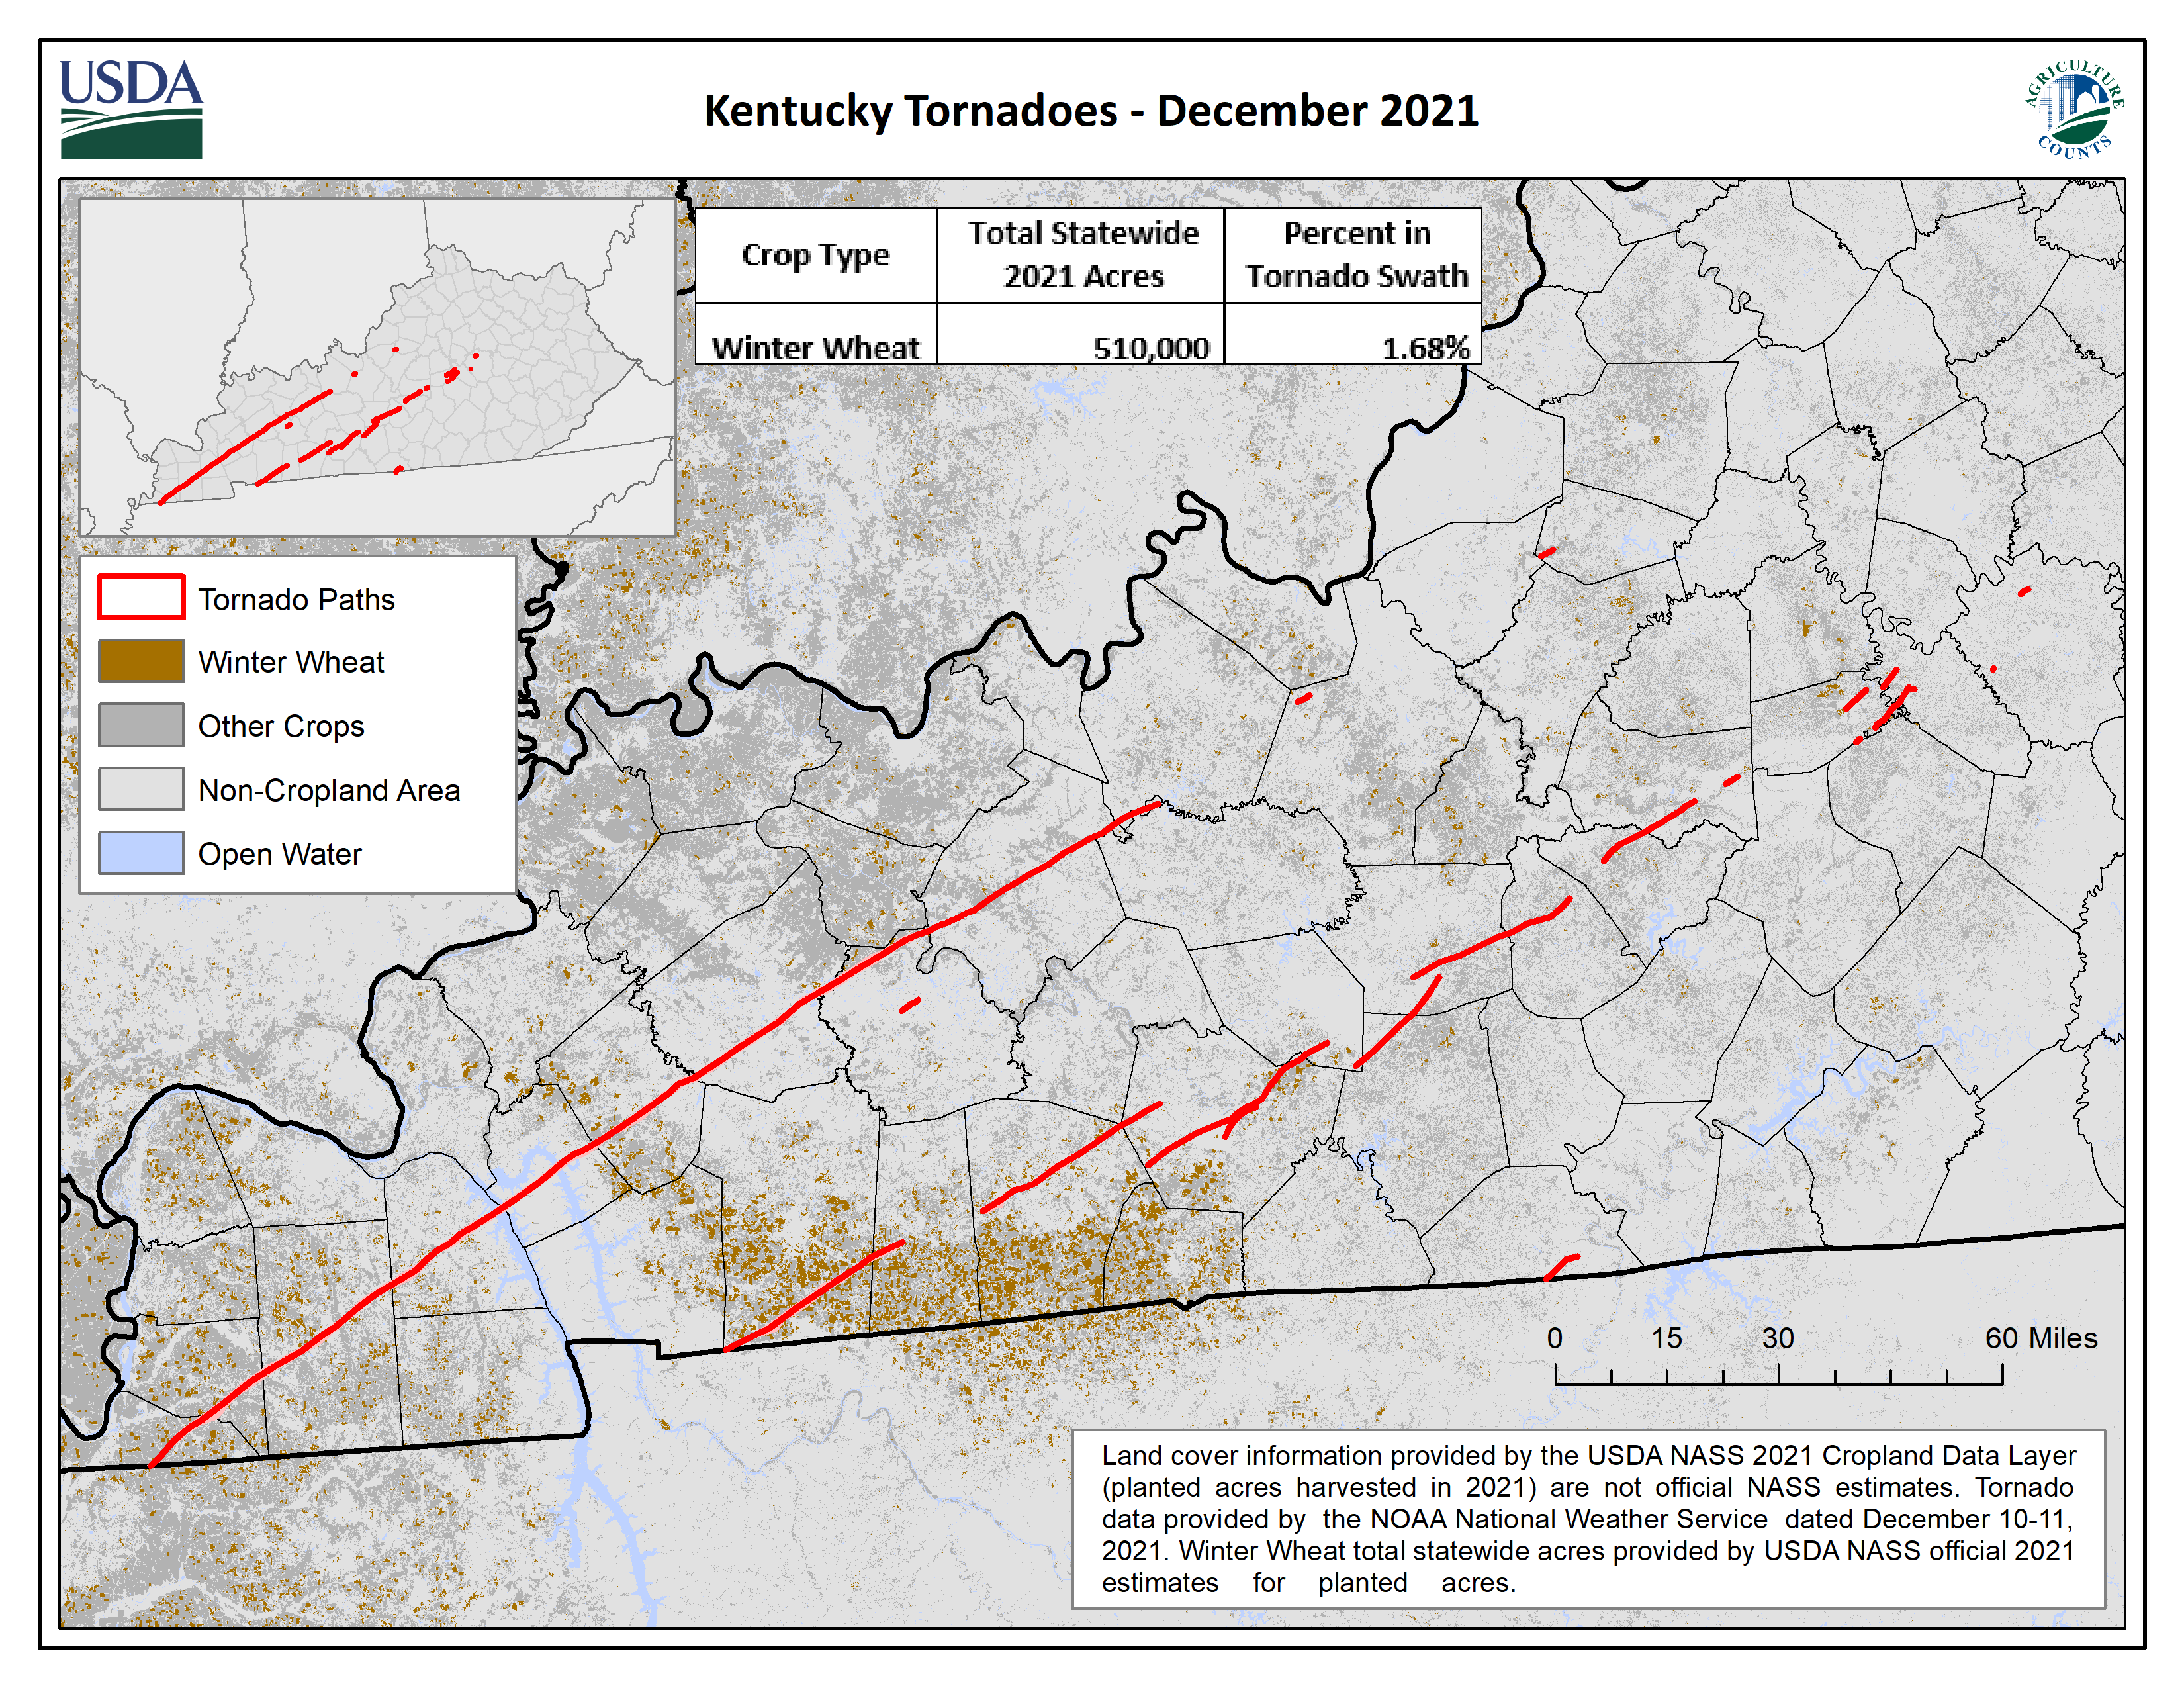
Download higher resolution map: PNG | PDF
Kansas Wildfires – December 2021
On Wednesday December 15, 2021, a strong storm system spawned high winds that knocked over several power lines, which in turn sparked several wildfires in central Kansas. Fires continued into Thursday, December 16, 2021 across several counties in Kansas, including Russell, Rooks, Ellis, Osborne, Trego, Rush, Lane, Ness, and Wichita counties. The United States Department of Agriculture's National Agricultural Statistics Service (NASS) responded to inquiries regarding the extent of cropland and pasture/hay affected by Kansas wildfires occurring in mid-December 2021 in near real-time. Active wildfire perimeter location data was derived from Sentinel-2A and MODIS Aqua optical imagery dated December 18, 2021. Land cover information, including grassland and pasture/hay, was derived from the NASS 2020 Cropland Data Layer and the NASS 2020 Cultivated Layer.
Files available for download: Kansas Wildfires Synopsis | Fire Perimeter Shapefile Zip File | Fire Report
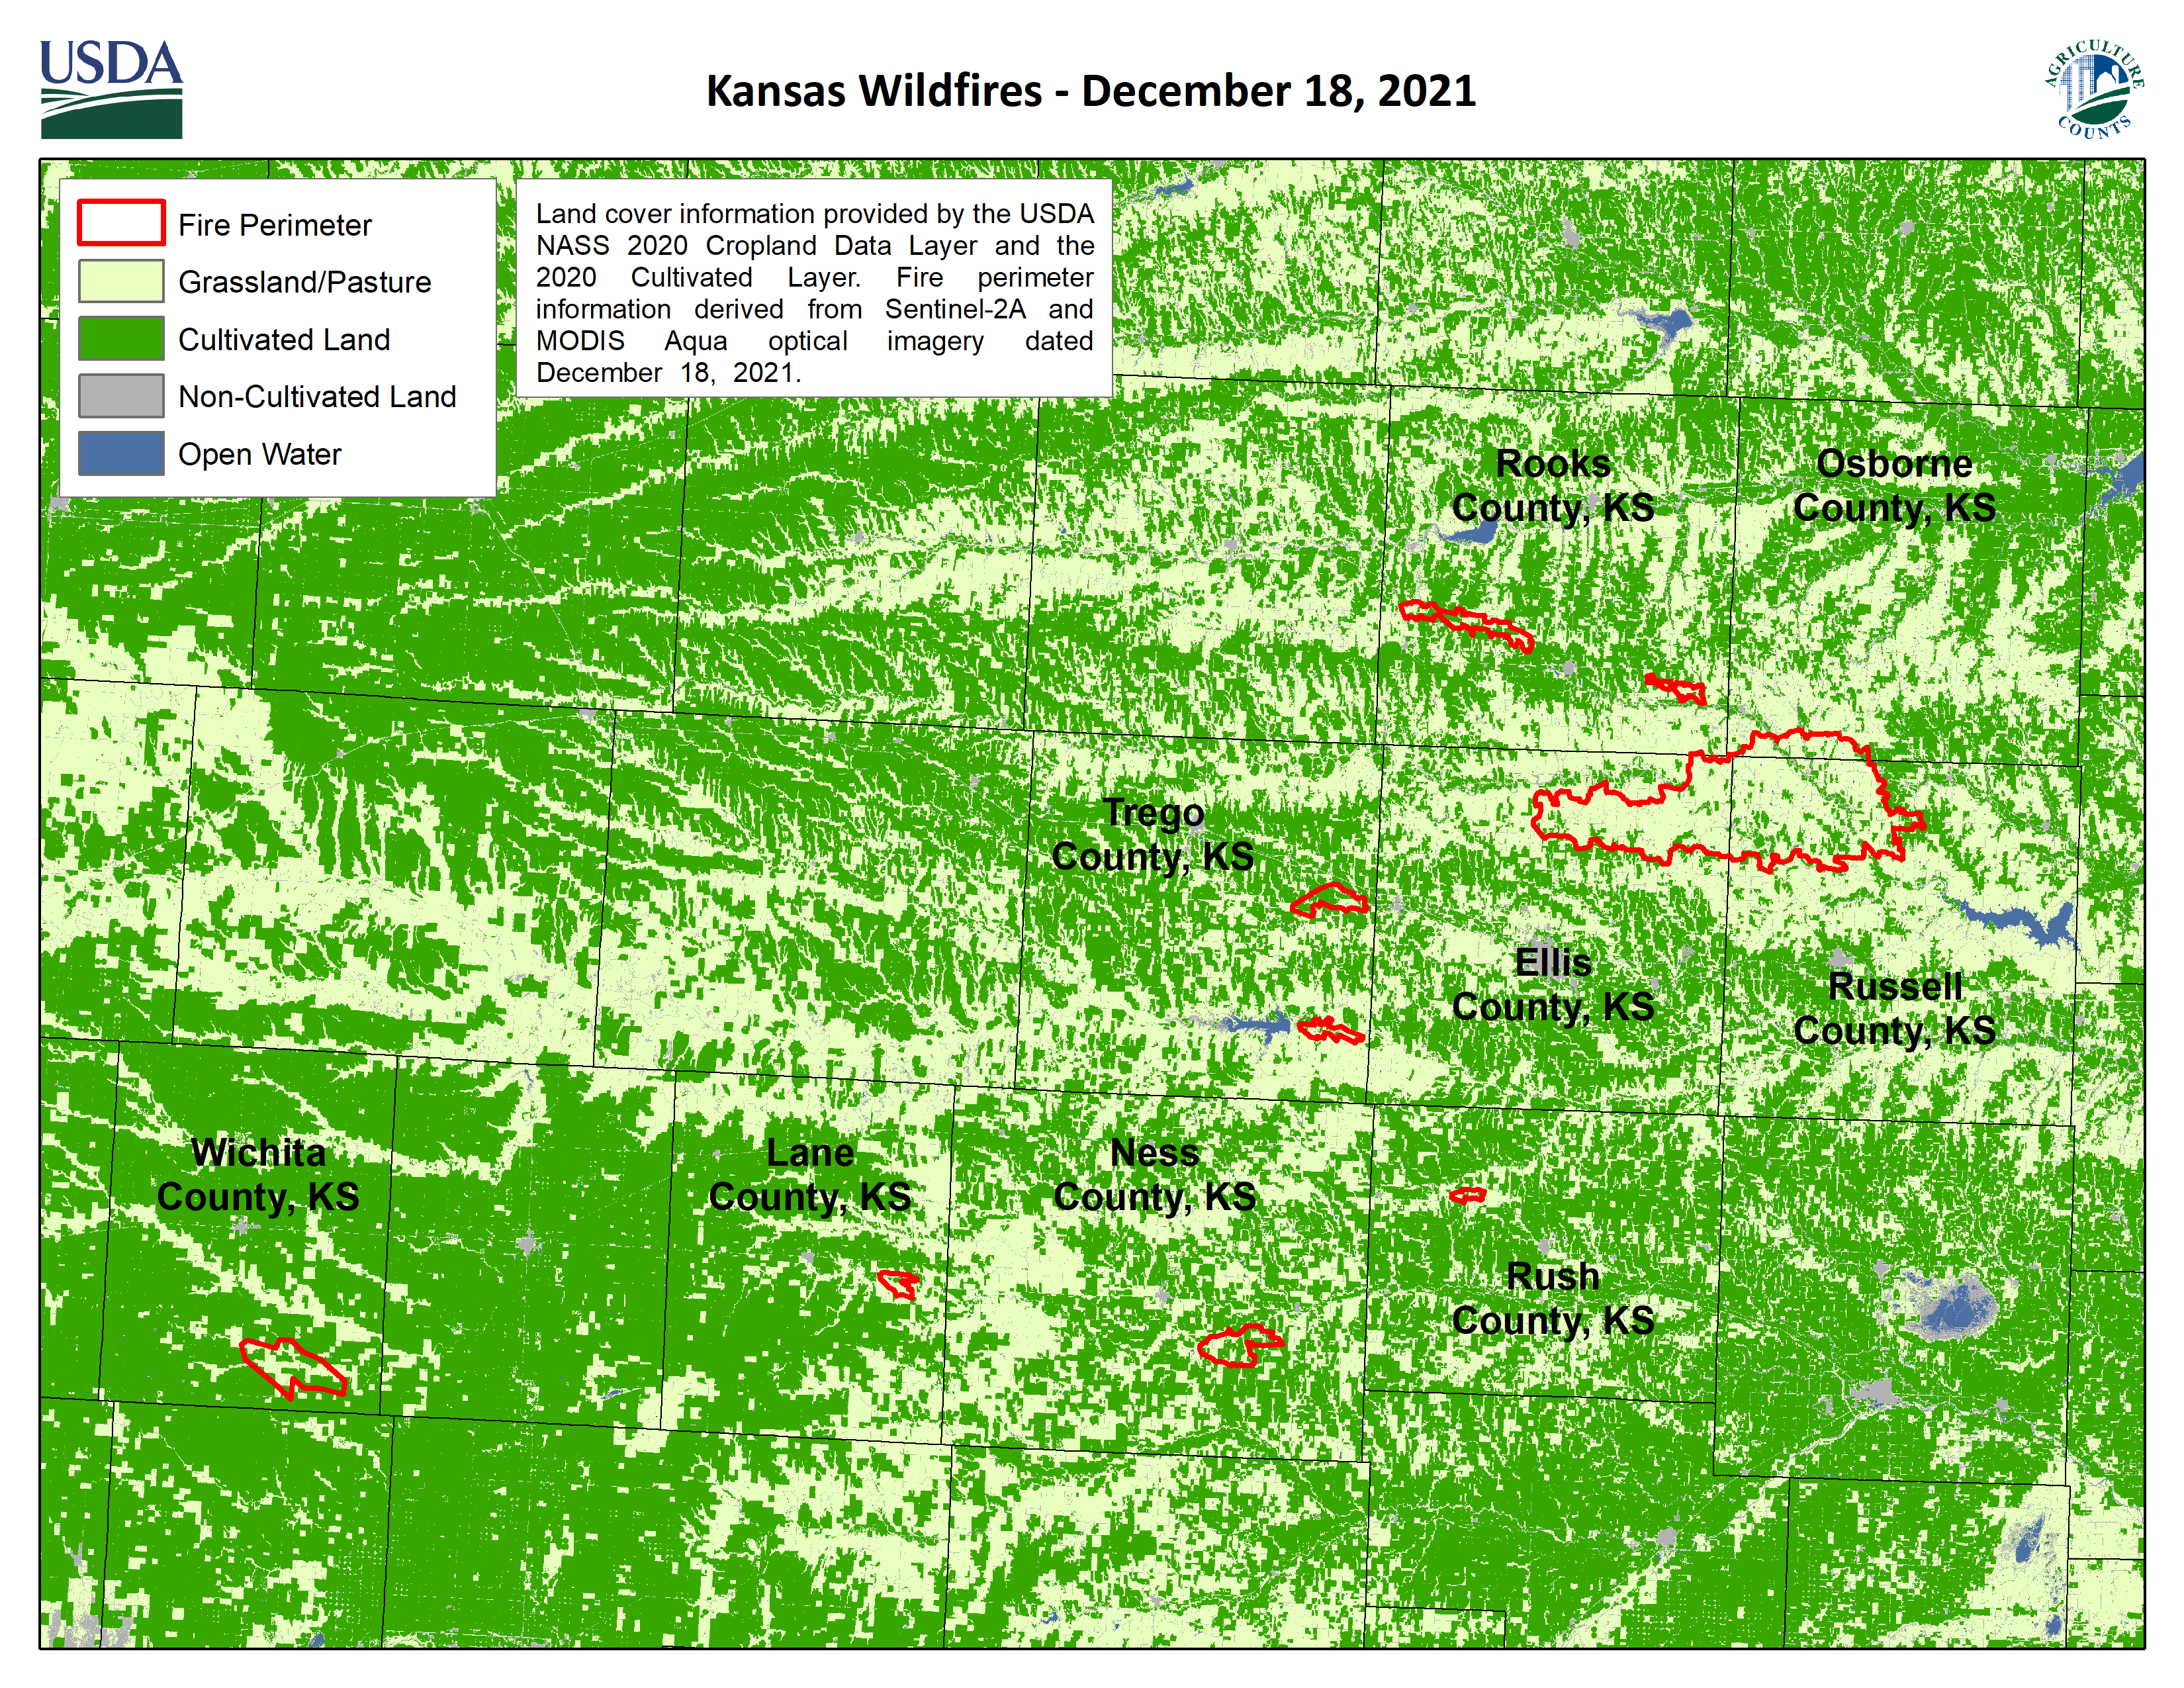
Download higher resolution map: PNG | PDF
Hurricane Ida – August 2021
Hurricane Ida impacted areas of Louisiana and Mississippi, United States from August 29-31, 2021 as a category 4 hurricane. The United States Department of Agriculture's National Agricultural Statistics Service (NASS) responded to inquiries regarding the extent of flooding from Hurricane Ida over agricultural land in near real-time. The map below identifies the extent of agriculture (2020 USDA NASS Cropland Data Layer) that intersects with wind swath data from the National Hurricane Center and Central Pacific Hurricane Center.
Additional analysis of the hurricane’s impact on sugarcane was performed for a subset of Louisiana parishes using freely available soil moisture data from Crop-CASMA (Crop Condition and Soil Moisture Analytics) for August 30, 2021. The Louisiana Assessment Report below details the soil moisture descriptions, maps, and tables associated with this event.
Files available for download: Hurricane Ida Synopsis
Additional Louisiana parish analysis: Louisiana Assessment Report
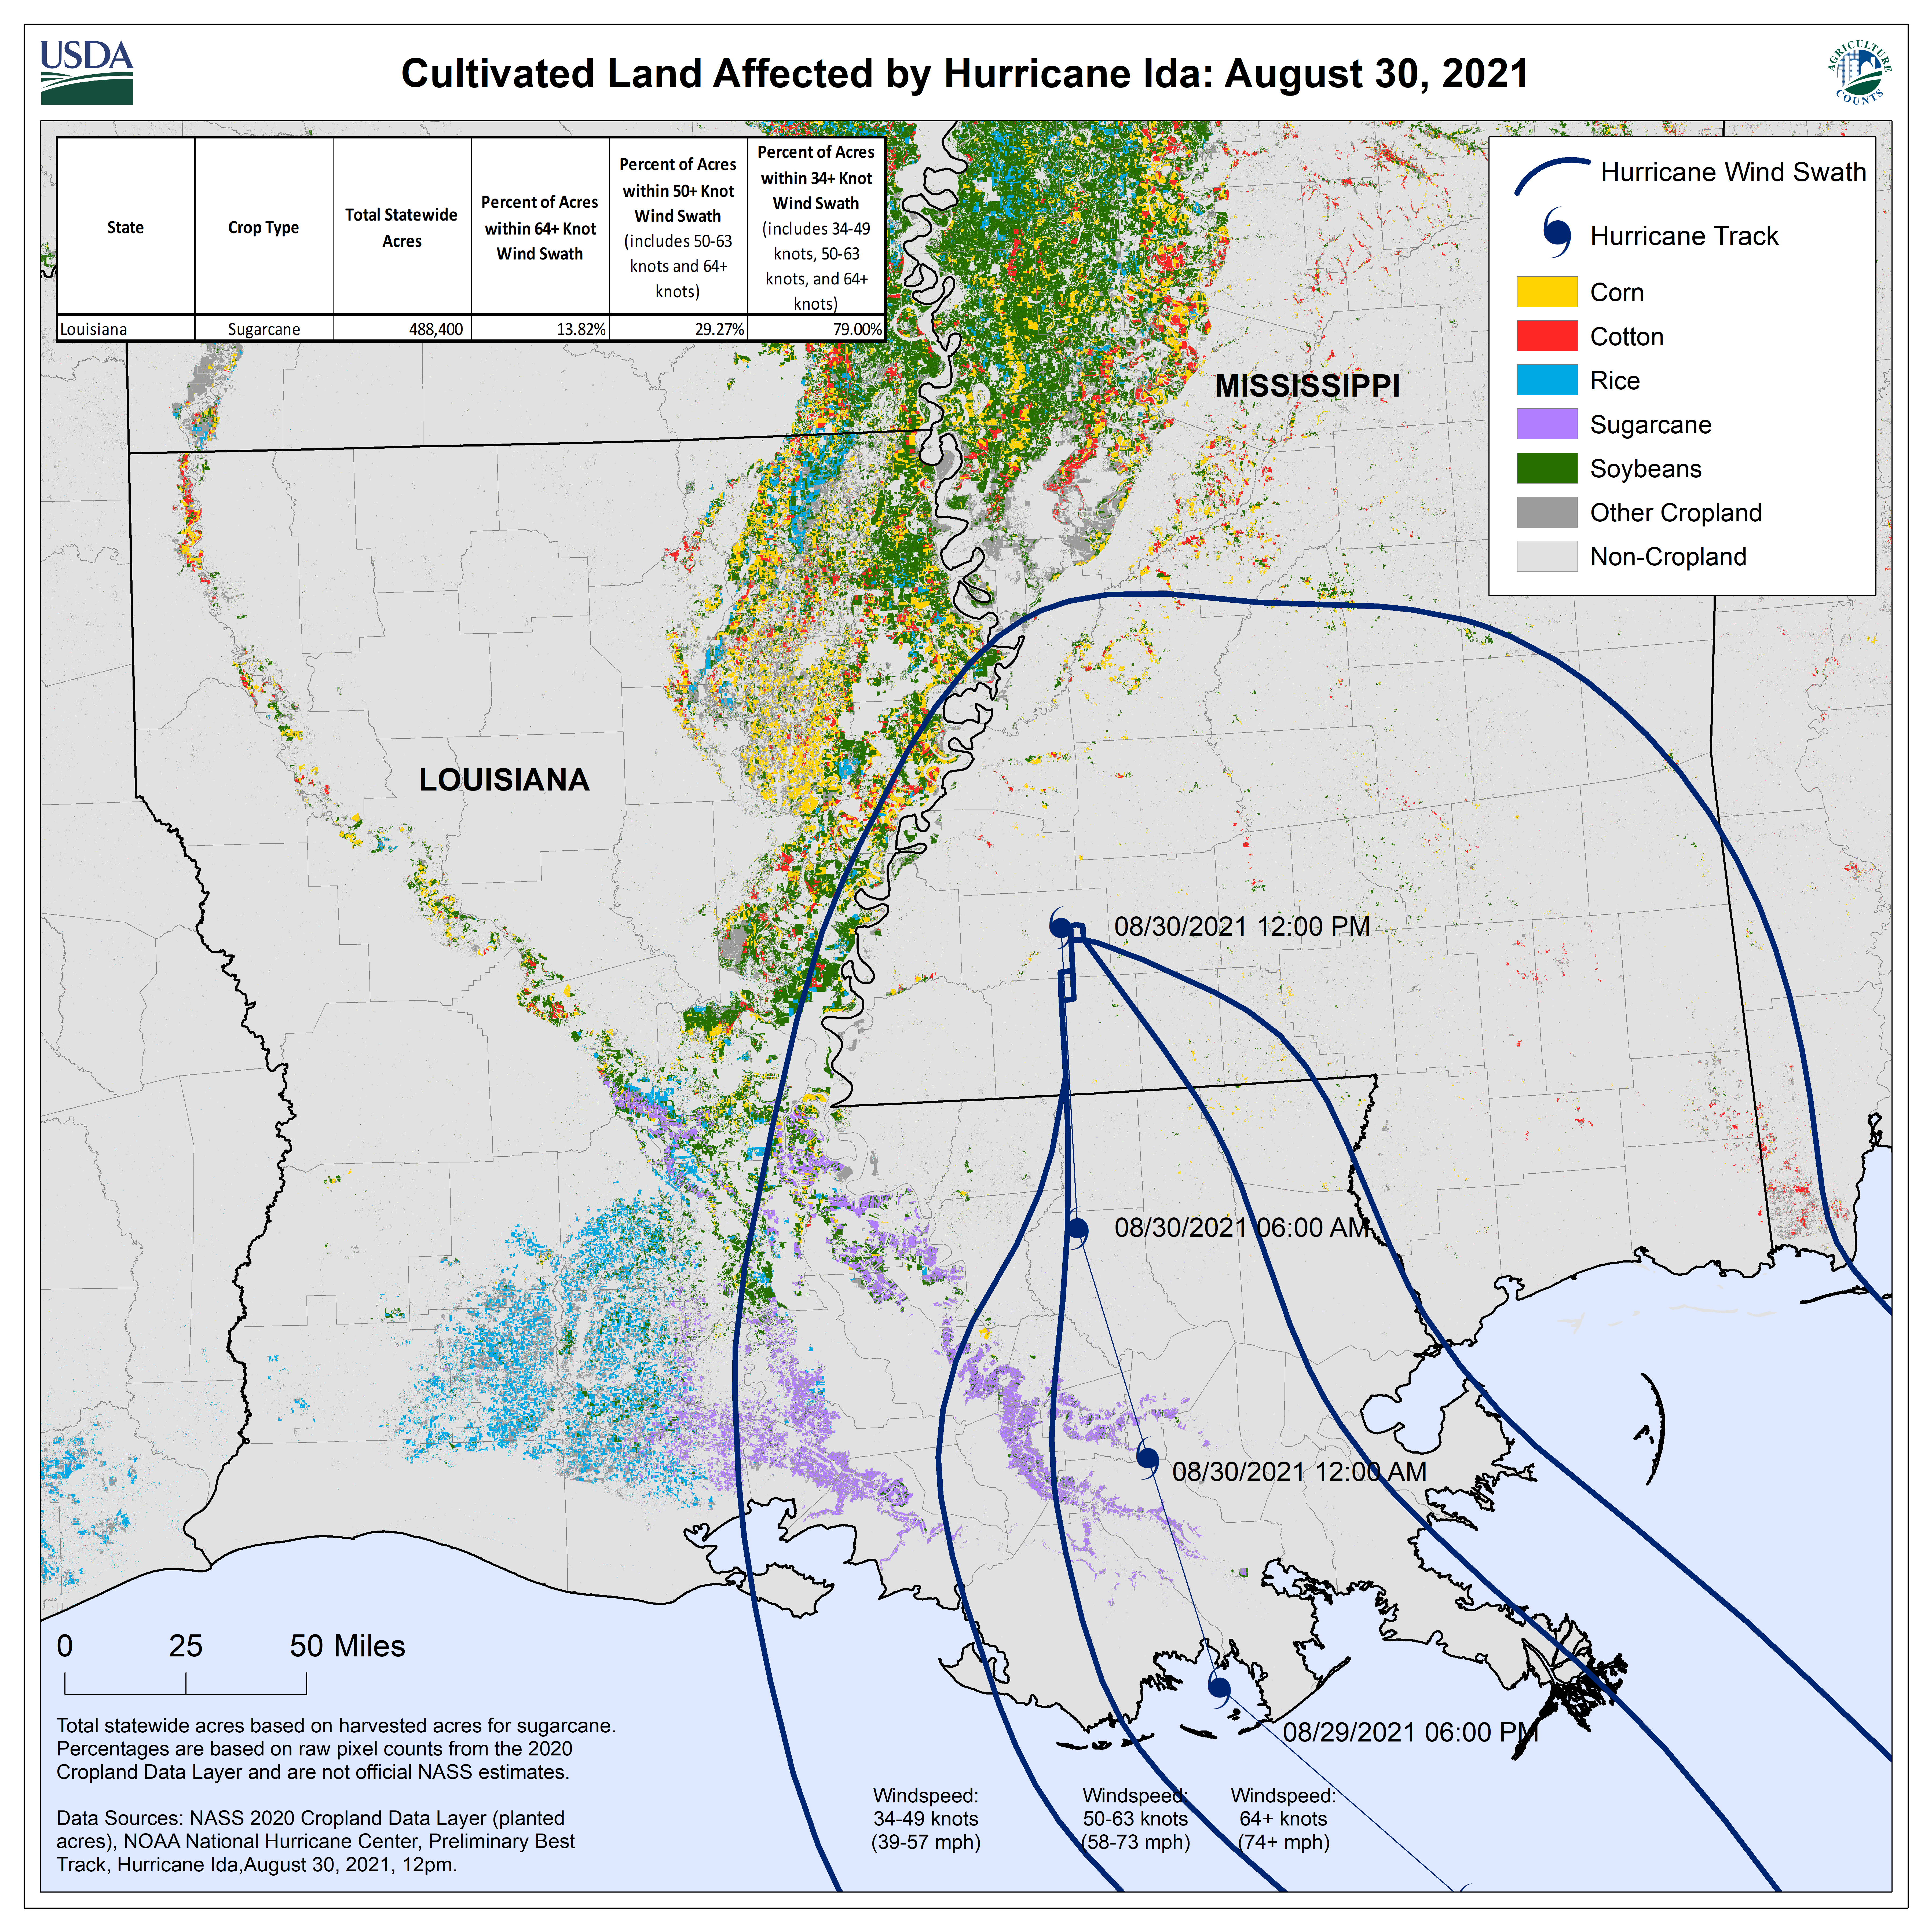
Download higher resolution map: PNG | PDF
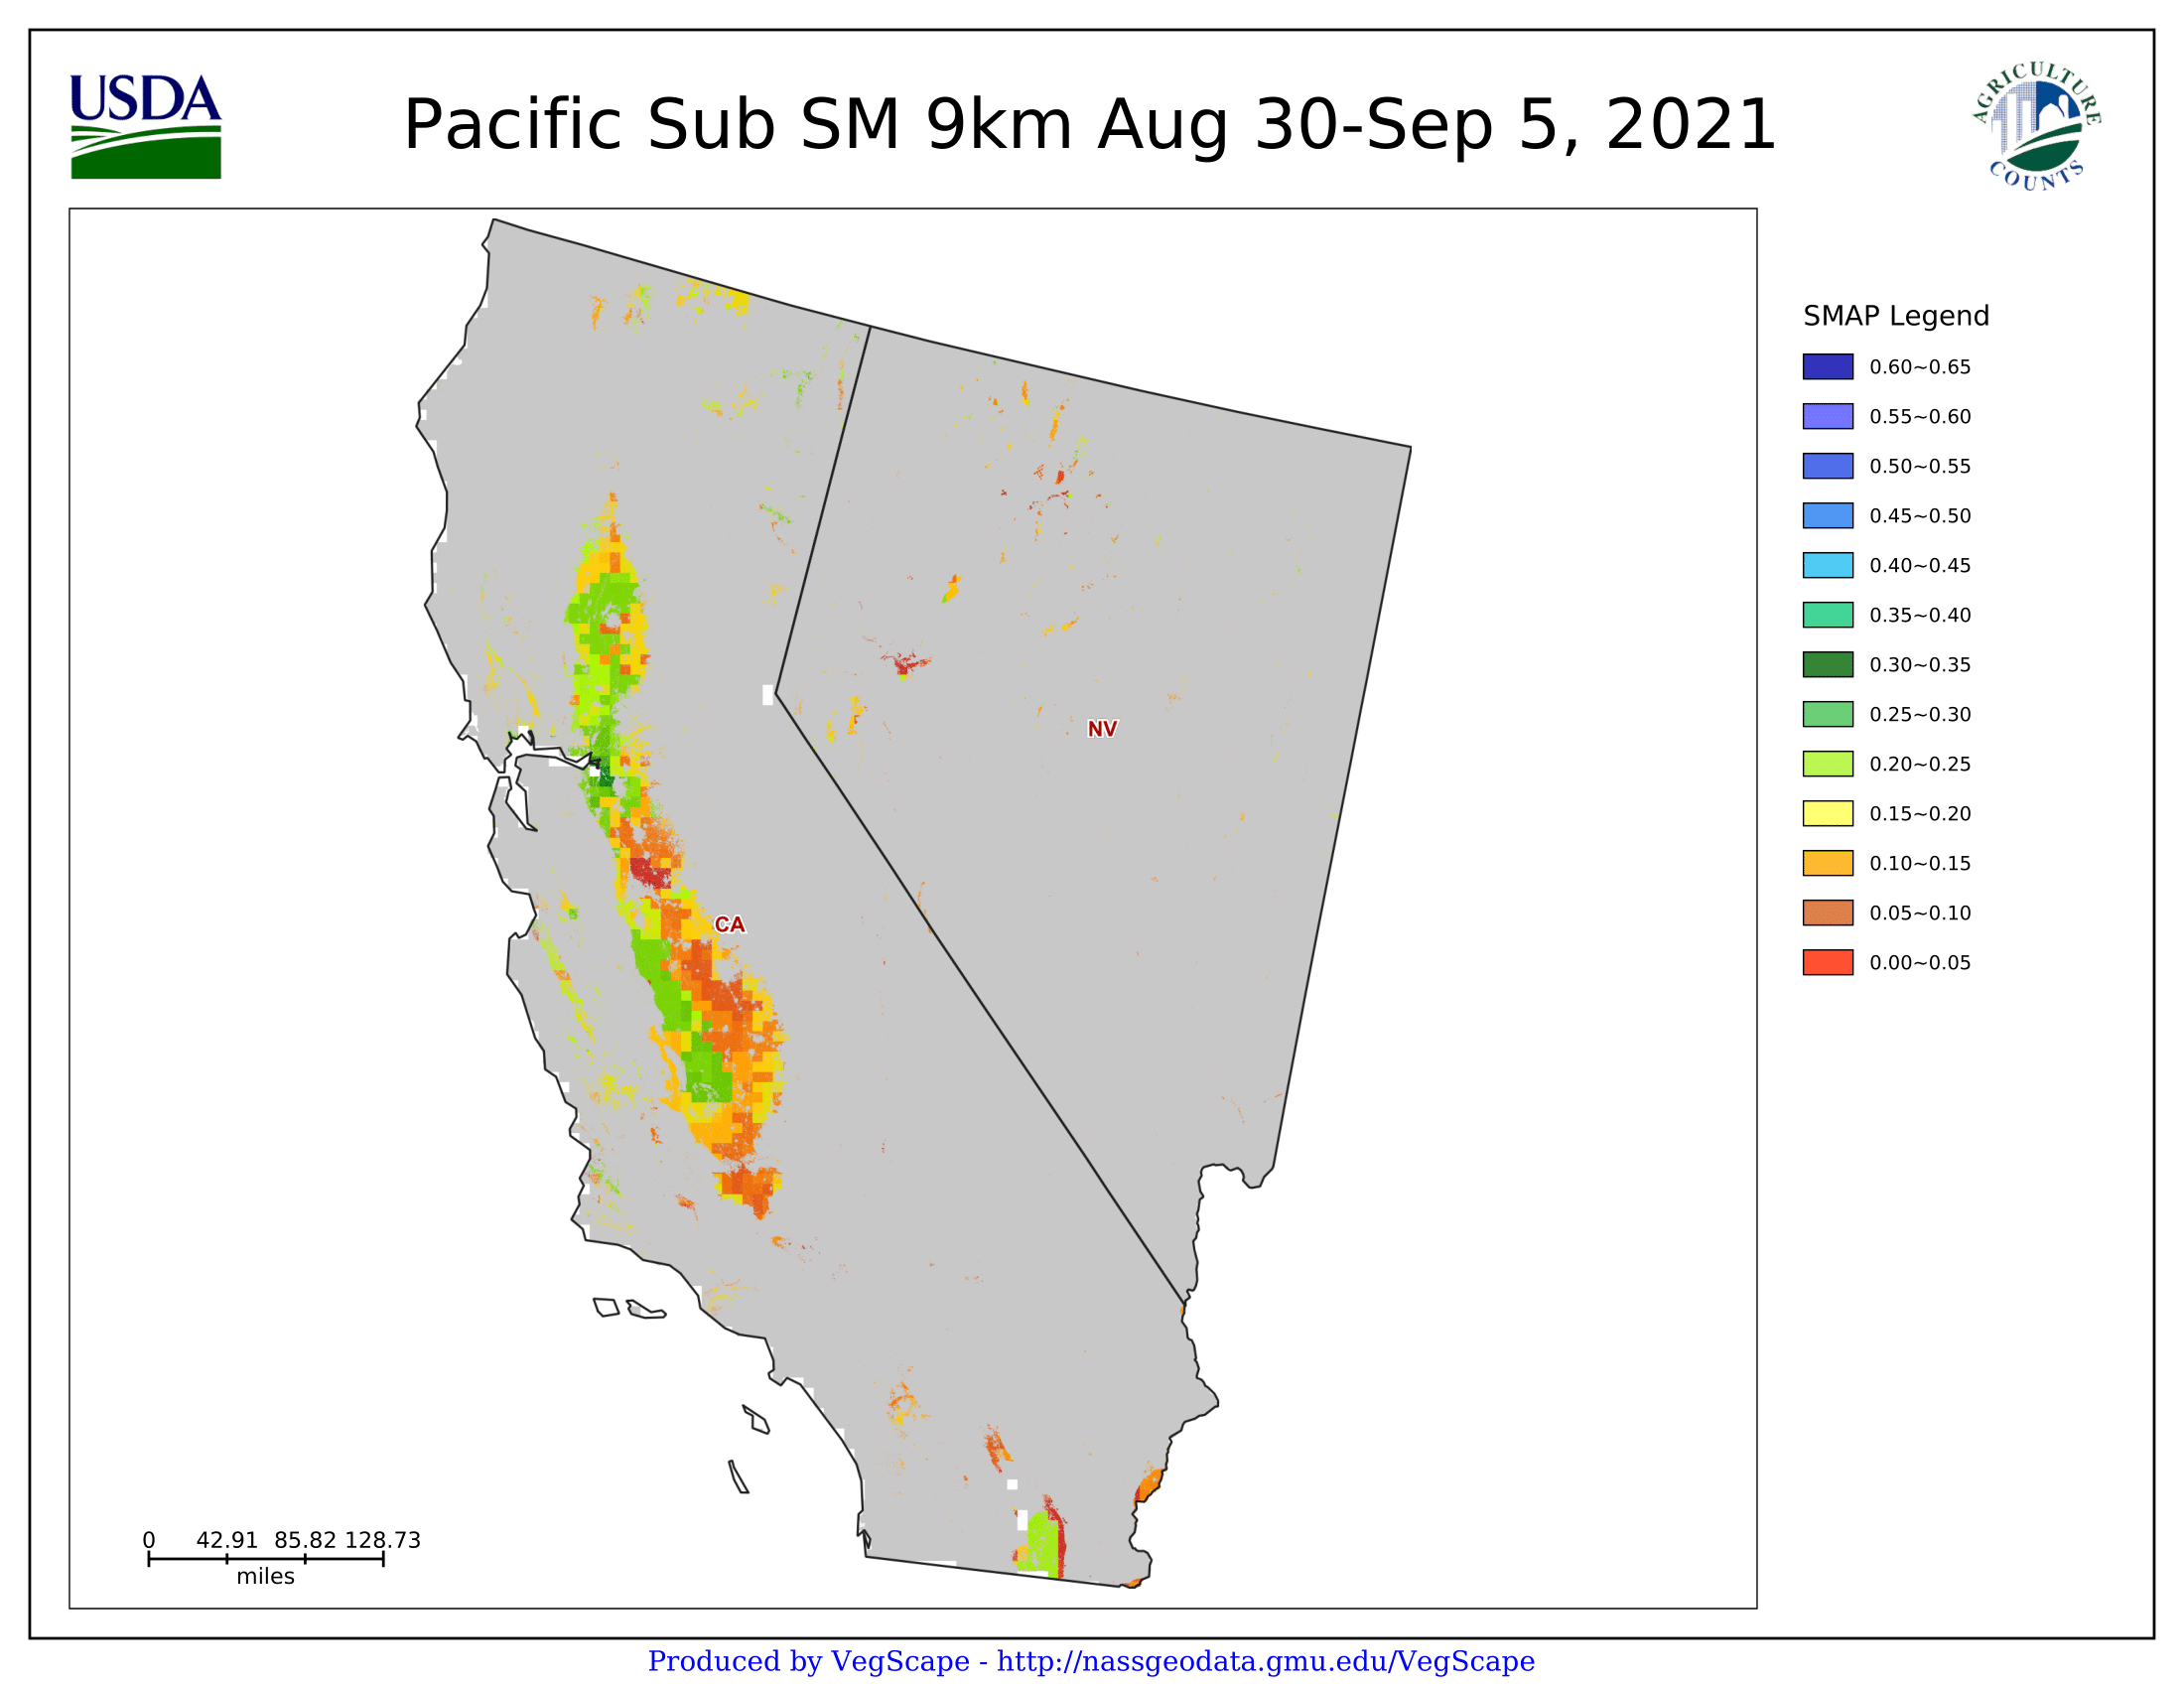
Western U.S. Drought and Extreme Heat Event (July/August 2021)
The western U.S. is experiencing ongoing extreme heat and drought conditions as of July and August 2021. The United States Department of Agriculture's National Agricultural Statistics Service (NASS) responded to inquiries regarding the event in five NASS Regions: Northwest, Pacific, Mountain, Northern Plains, and Upper Midwest. The report is updated weekly beginning with Week 27 (July 5-11, 2021).
Weekly reports are made available that illustrate the following data:
- Temperature and precipitation anomalies for the conterminous U.S. from the first day of the month provided by PRISM Climate Group
- Areas impacted by heat stress on a weekly cadence provided by the NASS Climate-based Information System
- Cropland sub soil moisture values and anomalies provided by Crop-CASMA (Crop Condition and Soil Moisture Analytics).
The map below illustrates sub soil moisture values from Crop-CASMA at a 9km resolution over cropland areas in California and Nevada (Pacific Region) for Week 35 (August 30-September 5, 2021). This map, along with many other maps, tables, and graphics, are available for download below.
Files available for download:
*Week 35 is the last planned weekly report in this series
Week 35 (August 30-September 5, 2021): Assessment Report | Synopsis
Week 34 (August 23-August 29, 2021): Assessment Report | Synopsis
Week 33 (August 16-August 22, 2021): Assessment Report | Synopsis
Week 32 (August 9-August 15, 2021): Assessment Report | Synopsis
Week 31 (August 2-August 8, 2021): Assessment Report | Synopsis
Week 30 (July 26-August 1, 2021): Assessment Report | Synopsis
Week 29 (July 19-25, 2021): Assessment Report | Synopsis
Week 28 (July 12-18, 2021): Assessment Report | Synopsis
Week 27 (July 5-11, 2021): Assessment Report | Synopsis
Download higher resolution map: PNG | PDF
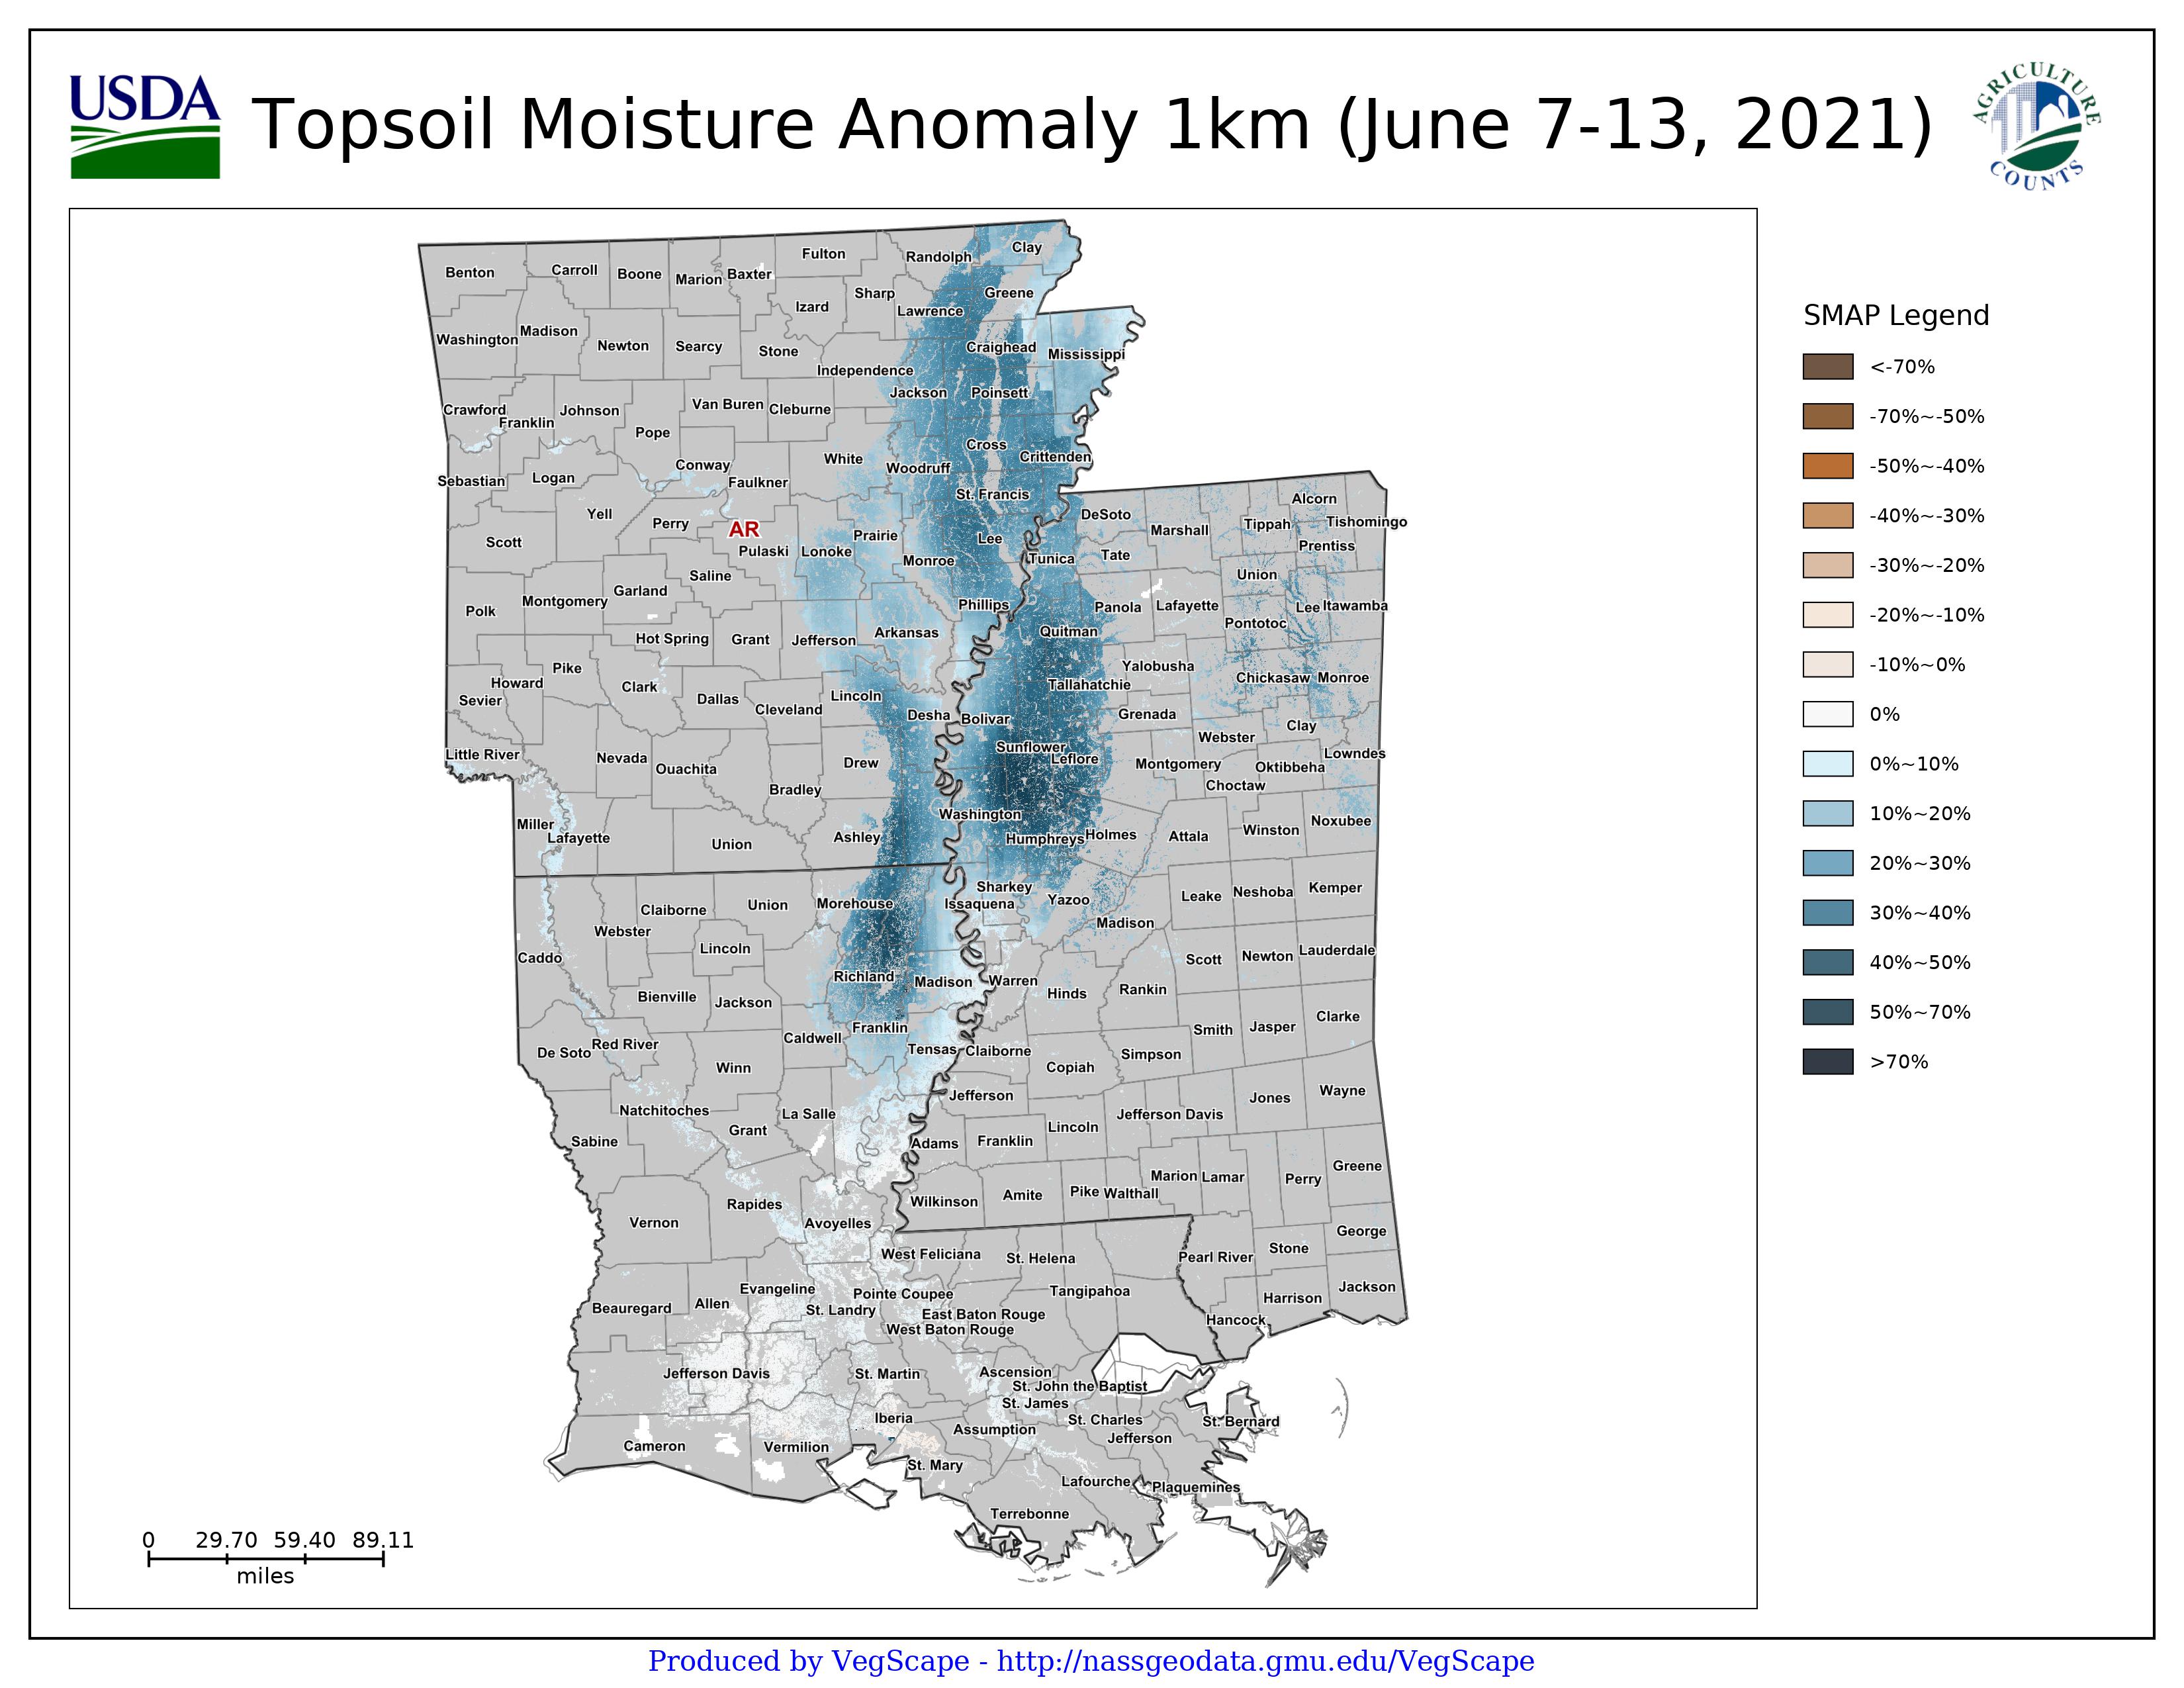
Delta Region Flooding (June 2021)
The Delta Region of the United States experienced severe flooding during early June 2021. The United States Department of Agriculture's National Agricultural Statistics Service (NASS) responded to inquiries regarding the extent of flooding over agricultural land in Arkansas, Mississippi, and Louisiana. Using freely available soil moisture data from Crop-CASMA (Crop Condition and Soil Moisture Analytics), the weekly (June 7-13, 2021) soil moisture content and anomaly values show higher than normal soil moisture in the region. The percent of cultivated land and specific crops determined by the 2020 NASS Cropland Data Layer in each soil moisture category were calculated. The Delta Region Report below details the soil moisture descriptions, maps, and tables associated with this event. For this event, specific county analysis is also available for a subset of Mississippi counties, which is also included for download below.
Files available for download: Delta Region Synopsis | Delta Region Assessment Report | Mississippi Synopsis | Mississippi Assessment Report
Download higher resolution map: PNG | PDF
Previous Years:
Return to current yearLast Modified: 04/08/2024